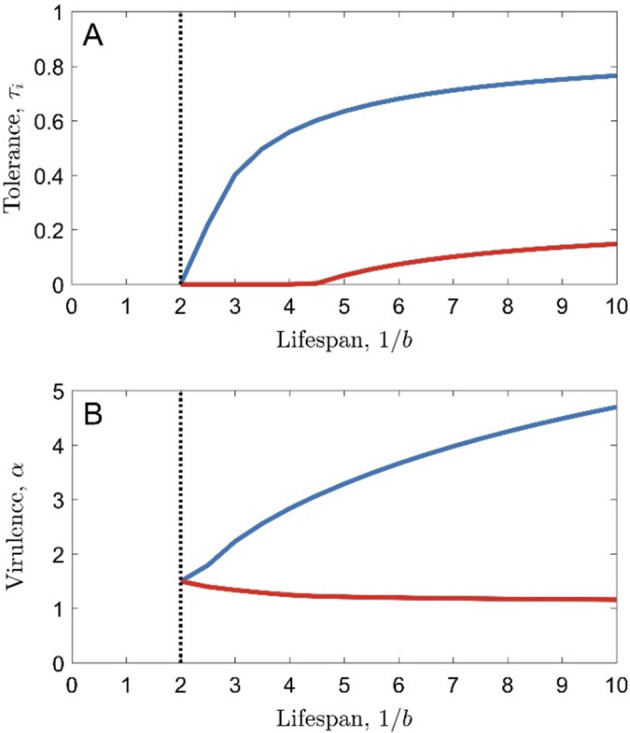
Fig. 3.

The effect of lifespan on tolerance-virulence coevolution, when tolerance is lifelong (blue curves) or limited to juveniles (red curves). The black, dashed line shows the lifespan below which the pathogen goes extinct. Parameters used are as in Table 1, with (so lifespan is measured in multiples of the average duration of infection), except for , and (full tolerance causes full sterility in the host). Results hold for all host and pathogen mutation rates (all values of ) (Color figure online)
