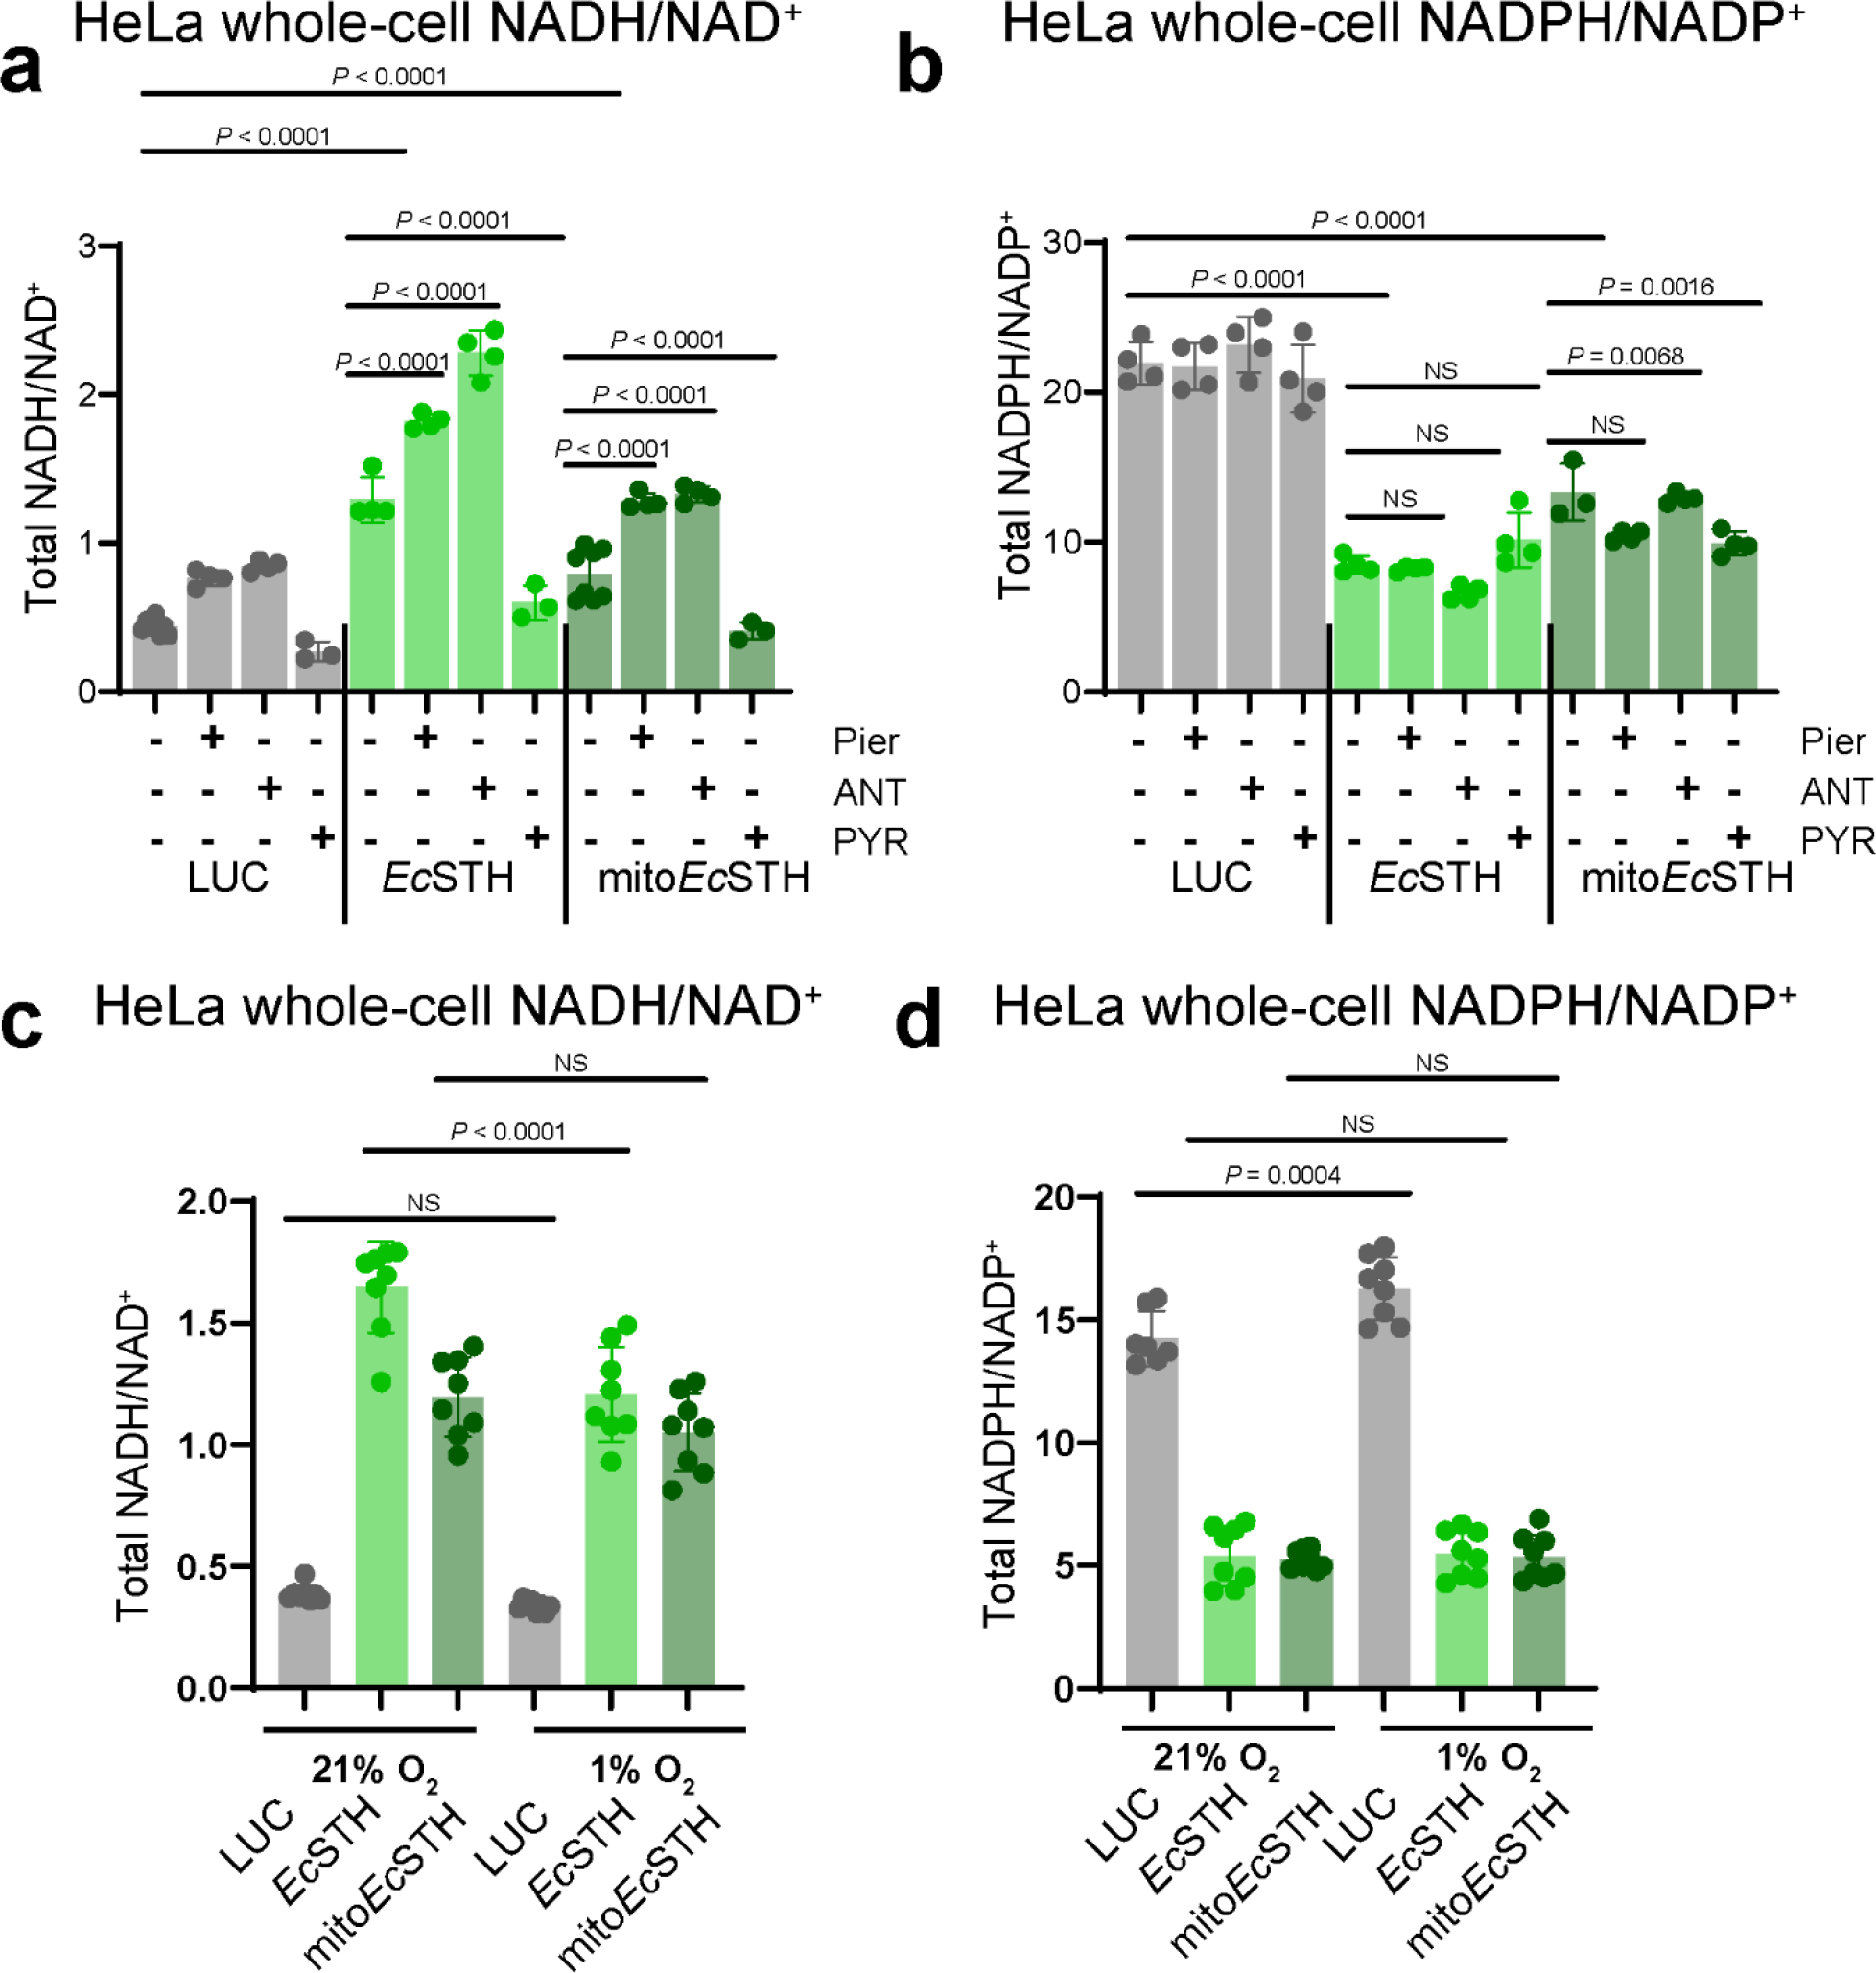
Extended Data Fig. 4.

The total NADH/NAD+ (a) and NADPH/NADP+ (b) ratios measured in HeLa cells expressing EcSTH and mitoEcSTH three hours after changing to fresh pyruvate-free DMEM+dFBS with 1 μM antimycin A (ANT), 1 μM piericidin A (Pier), or 1 mM pyruvate (PYR). The total NADH/NAD+ (c) and NADPH/NADP+ (d) ratios measured in HeLa cells expressing EcSTH and mitoEcSTH incubated for 24 hours at 5%CO2/1%O2 hypoxia. Values are mean ± s.d.; n = 8, 4, 4, 3 4, 4, 4, 3, 8, 4, 4, 3 in (a), n = 4 in (b-d) biologically independent samples. The statistical significance indicated for (a-d) represents a One-Way ANOVA followed by uncorrected Fisher’s least significant difference test. NS, no significant difference.
