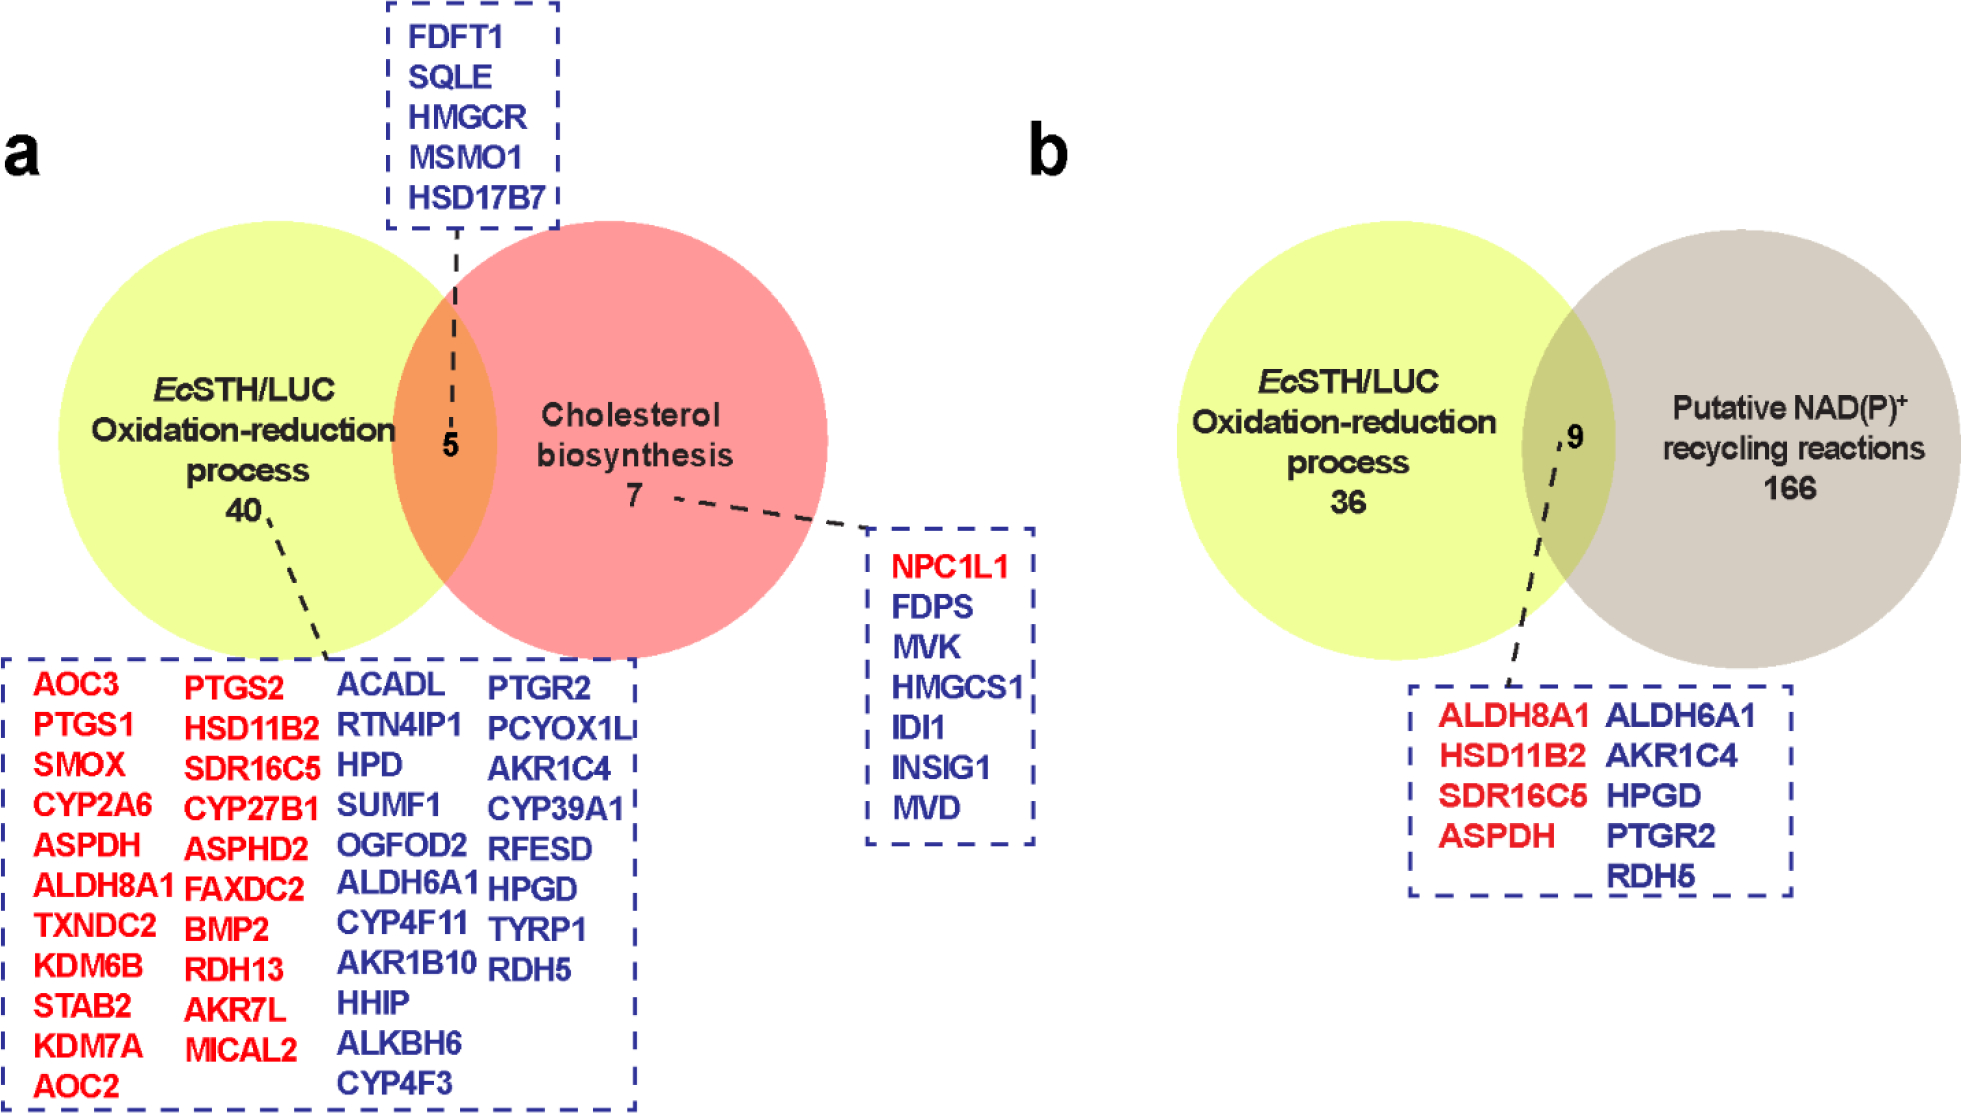
Extended Data Fig. 8.

(a-b) Venn diagrams displaying the similarities and differences of genes from indicated gene sets. Yellow circles include all genes in the GO term “oxidation-reduction” pathways (see Fig. 4e). The salmon circle contains all genes in the GO term “cholesterol biosynthetic” pathways (see Fig. 4e). The light brown circle indicates the NAD(P)ome (genes in humans that encode NAD+ or NADP+ dependent enzymes as defined in (27)). The up-regulated genes are marked in red and down-regulated genes are marked in blue.
