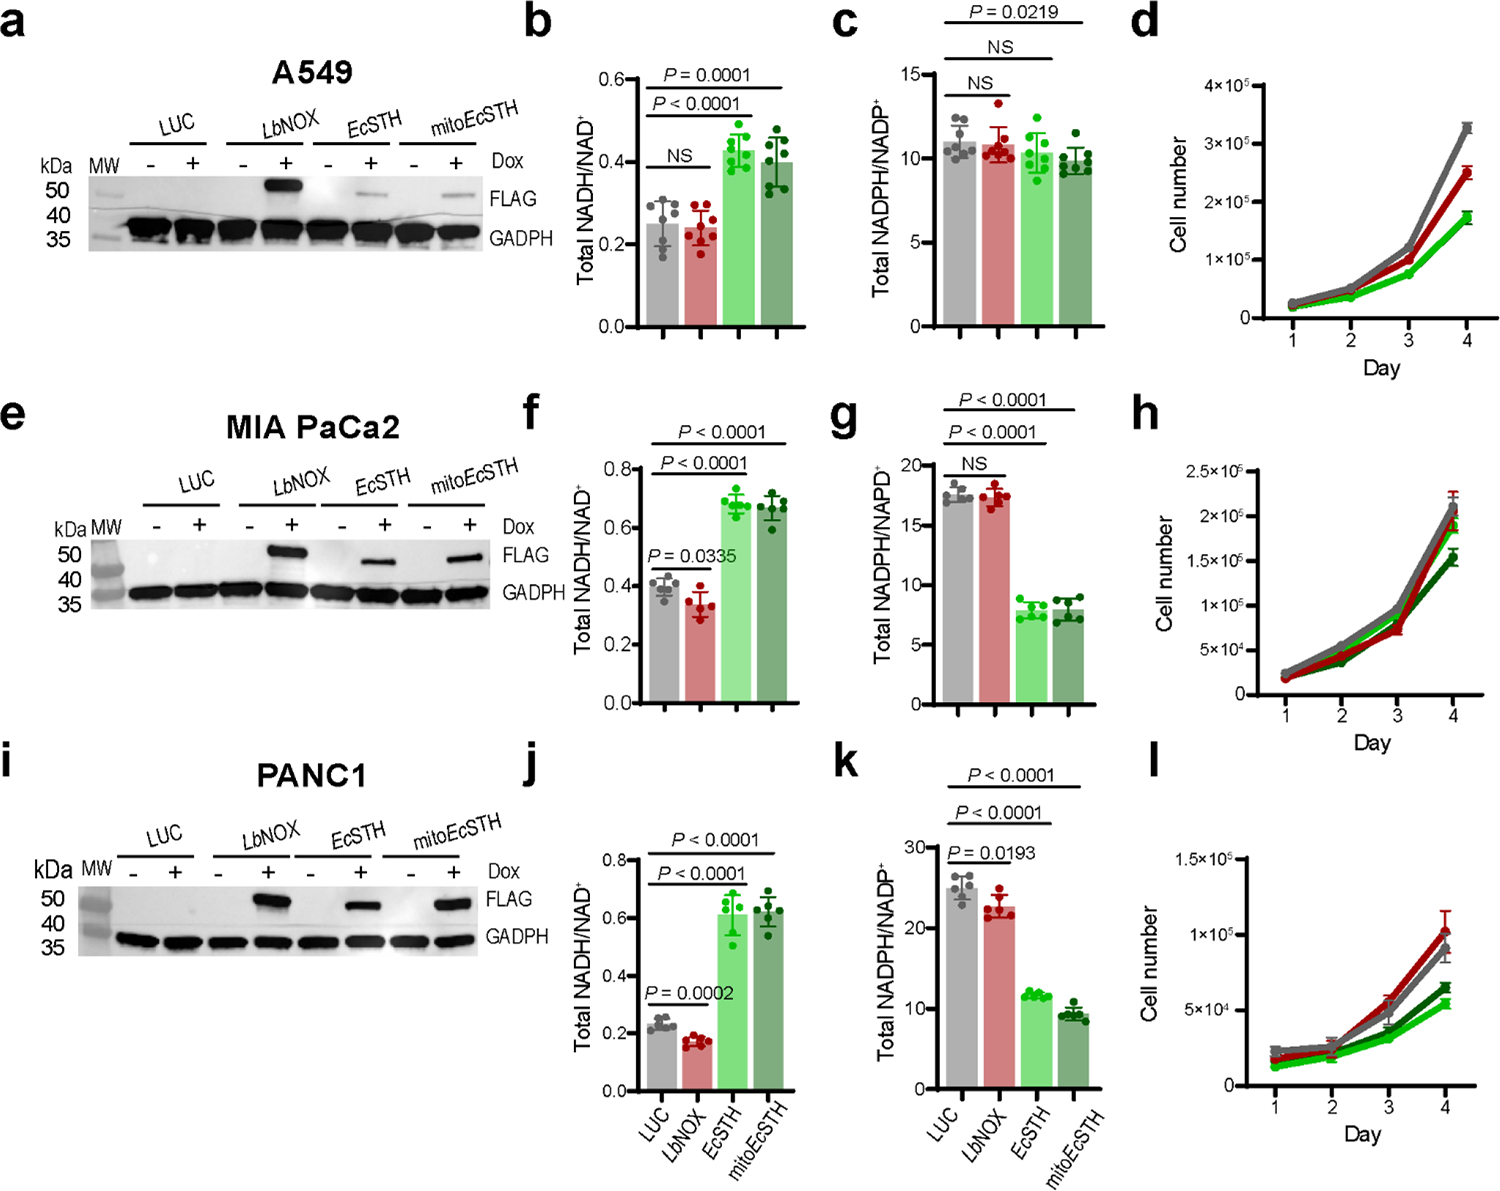
Extended Data Fig. 9.

Western blot analysis of EcSTH and mitoEcSTH expression in A549 lung adenocarcinoma cells (a), MIA PaCa-2 epithelial tumor tissue of the pancreas (e) and PANC-1 pancreatic duct epithelioid carcinoma (i). (a, e, i) Representative blots are shown. The total NADH/NAD+ ratios in A549 (b), MIA PaCa-2 (f) and PANC-1 (j) cells expressing EcSTH and mitoEcSTH. The total NADPH/NADP+ ratios in A549 (c), MIA PaCa-2 (g) and PANC-1 (k) cells expressing EcSTH and mitoEcSTH. Proliferation of A549 (d), MIA PaCa-2 (h) and PANC-1 (l) cells expressing EcSTH and mitoEcSTH in pyruvate-free DMEM+dFBS. LUC and LbNOX expressing HeLa cells were used as controls in (a-l). Values are mean ± s.d.; n = 8 in (b-c), n = 6 in (f, g, j, k) biologically independent samples. The statistical significance indicated for (b, c, f, g, j, k) represents a Welch ANOVA followed by unpaired t test. NS, no significant difference. For growth curves (d, h, l) error bars represent mean ± s.d.; n = 3 biologically independent samples.
