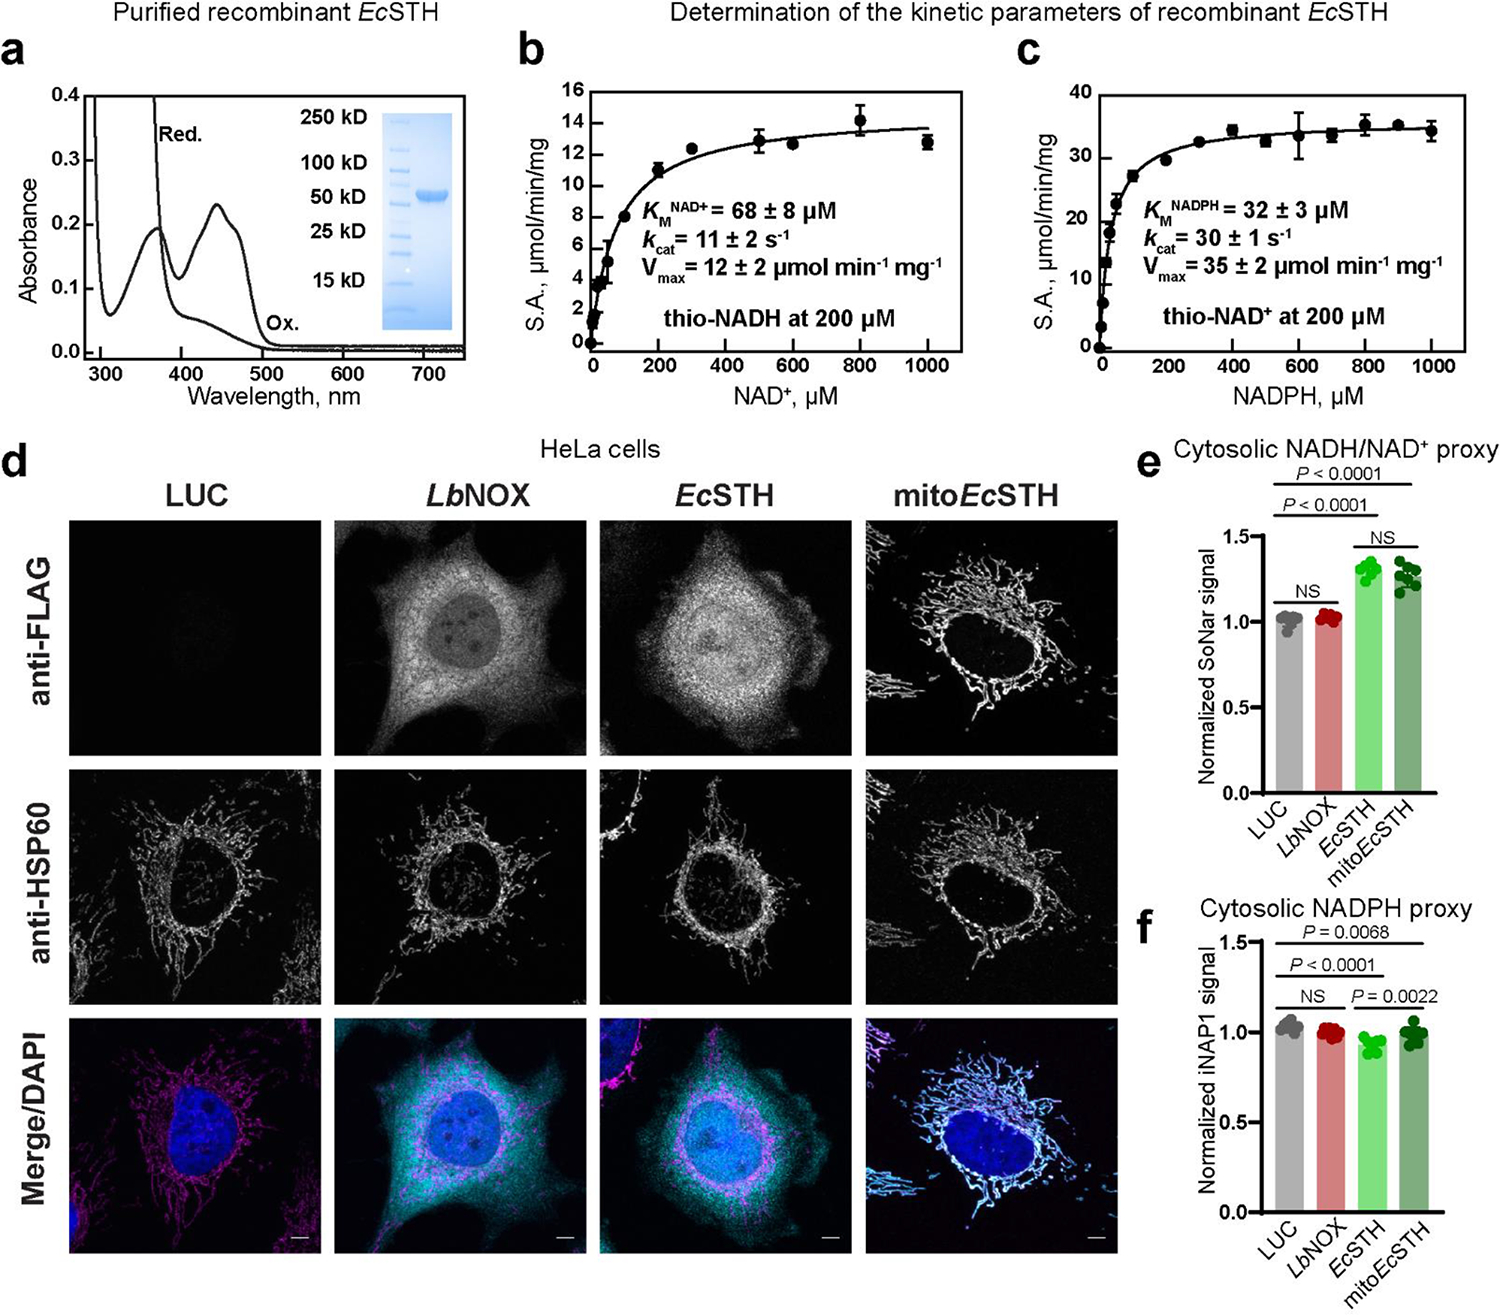
Figure 2. Determination of EcSTH kinetic parameters and visualization of EcSTH activity in live cells using genetically encoded sensors.

(a) UV-Visible spectrum of recombinant STH from E. coli (EcSTH) as purified at 20 μM FAD of active sites (Ox.) and after addition of excess of sodium dithionite (Red.). Insert: the SDS-PAGE of purified EcSTH. A representative SDS-PAGE is shown. Michaelis-Menten analysis of the reaction catalyzed by EcSTH with NAD+ (b) or NADPH (c). Reported values for Vmax, kcat and KM for NAD+ (thio-NADH was fixed at 200 μM) and NADPH (thio-NAD+ was fixed at 200 μM) are from Supplementary Fig. 3d. (d) Subcellular localization of untargeted EcSTH and mitochondrially targeted EcSTH (mitoEcSTH) in HeLa cells determined by fluorescence microscopy. HeLa cells expressing FLAG-tagged LbNOX, EcSTH, and mitoEcSTH proteins were co-stained for FLAG tag, HSP60 (mitochondrial marker) and DAPI (nucleus marker). Scale bars: 5 μm. Cytosolic NADH/NAD+ ratios (e) and NADPH levels (f) measured using genetically encoded sensors SoNar and iNAP1 in HeLa cells expressing EcSTH and mitoEcSTH. Values are mean ± s.d.; n = 2 in (b-c), n = 7, 6, 6, 7 in (e), n = 8, 8, 7, 8 in (f) biologically independent samples. The statistical significance indicated for (e-f) represents a One-Way ANOVA followed by uncorrected Fisher’s least significant difference test. NS, no significant difference.
