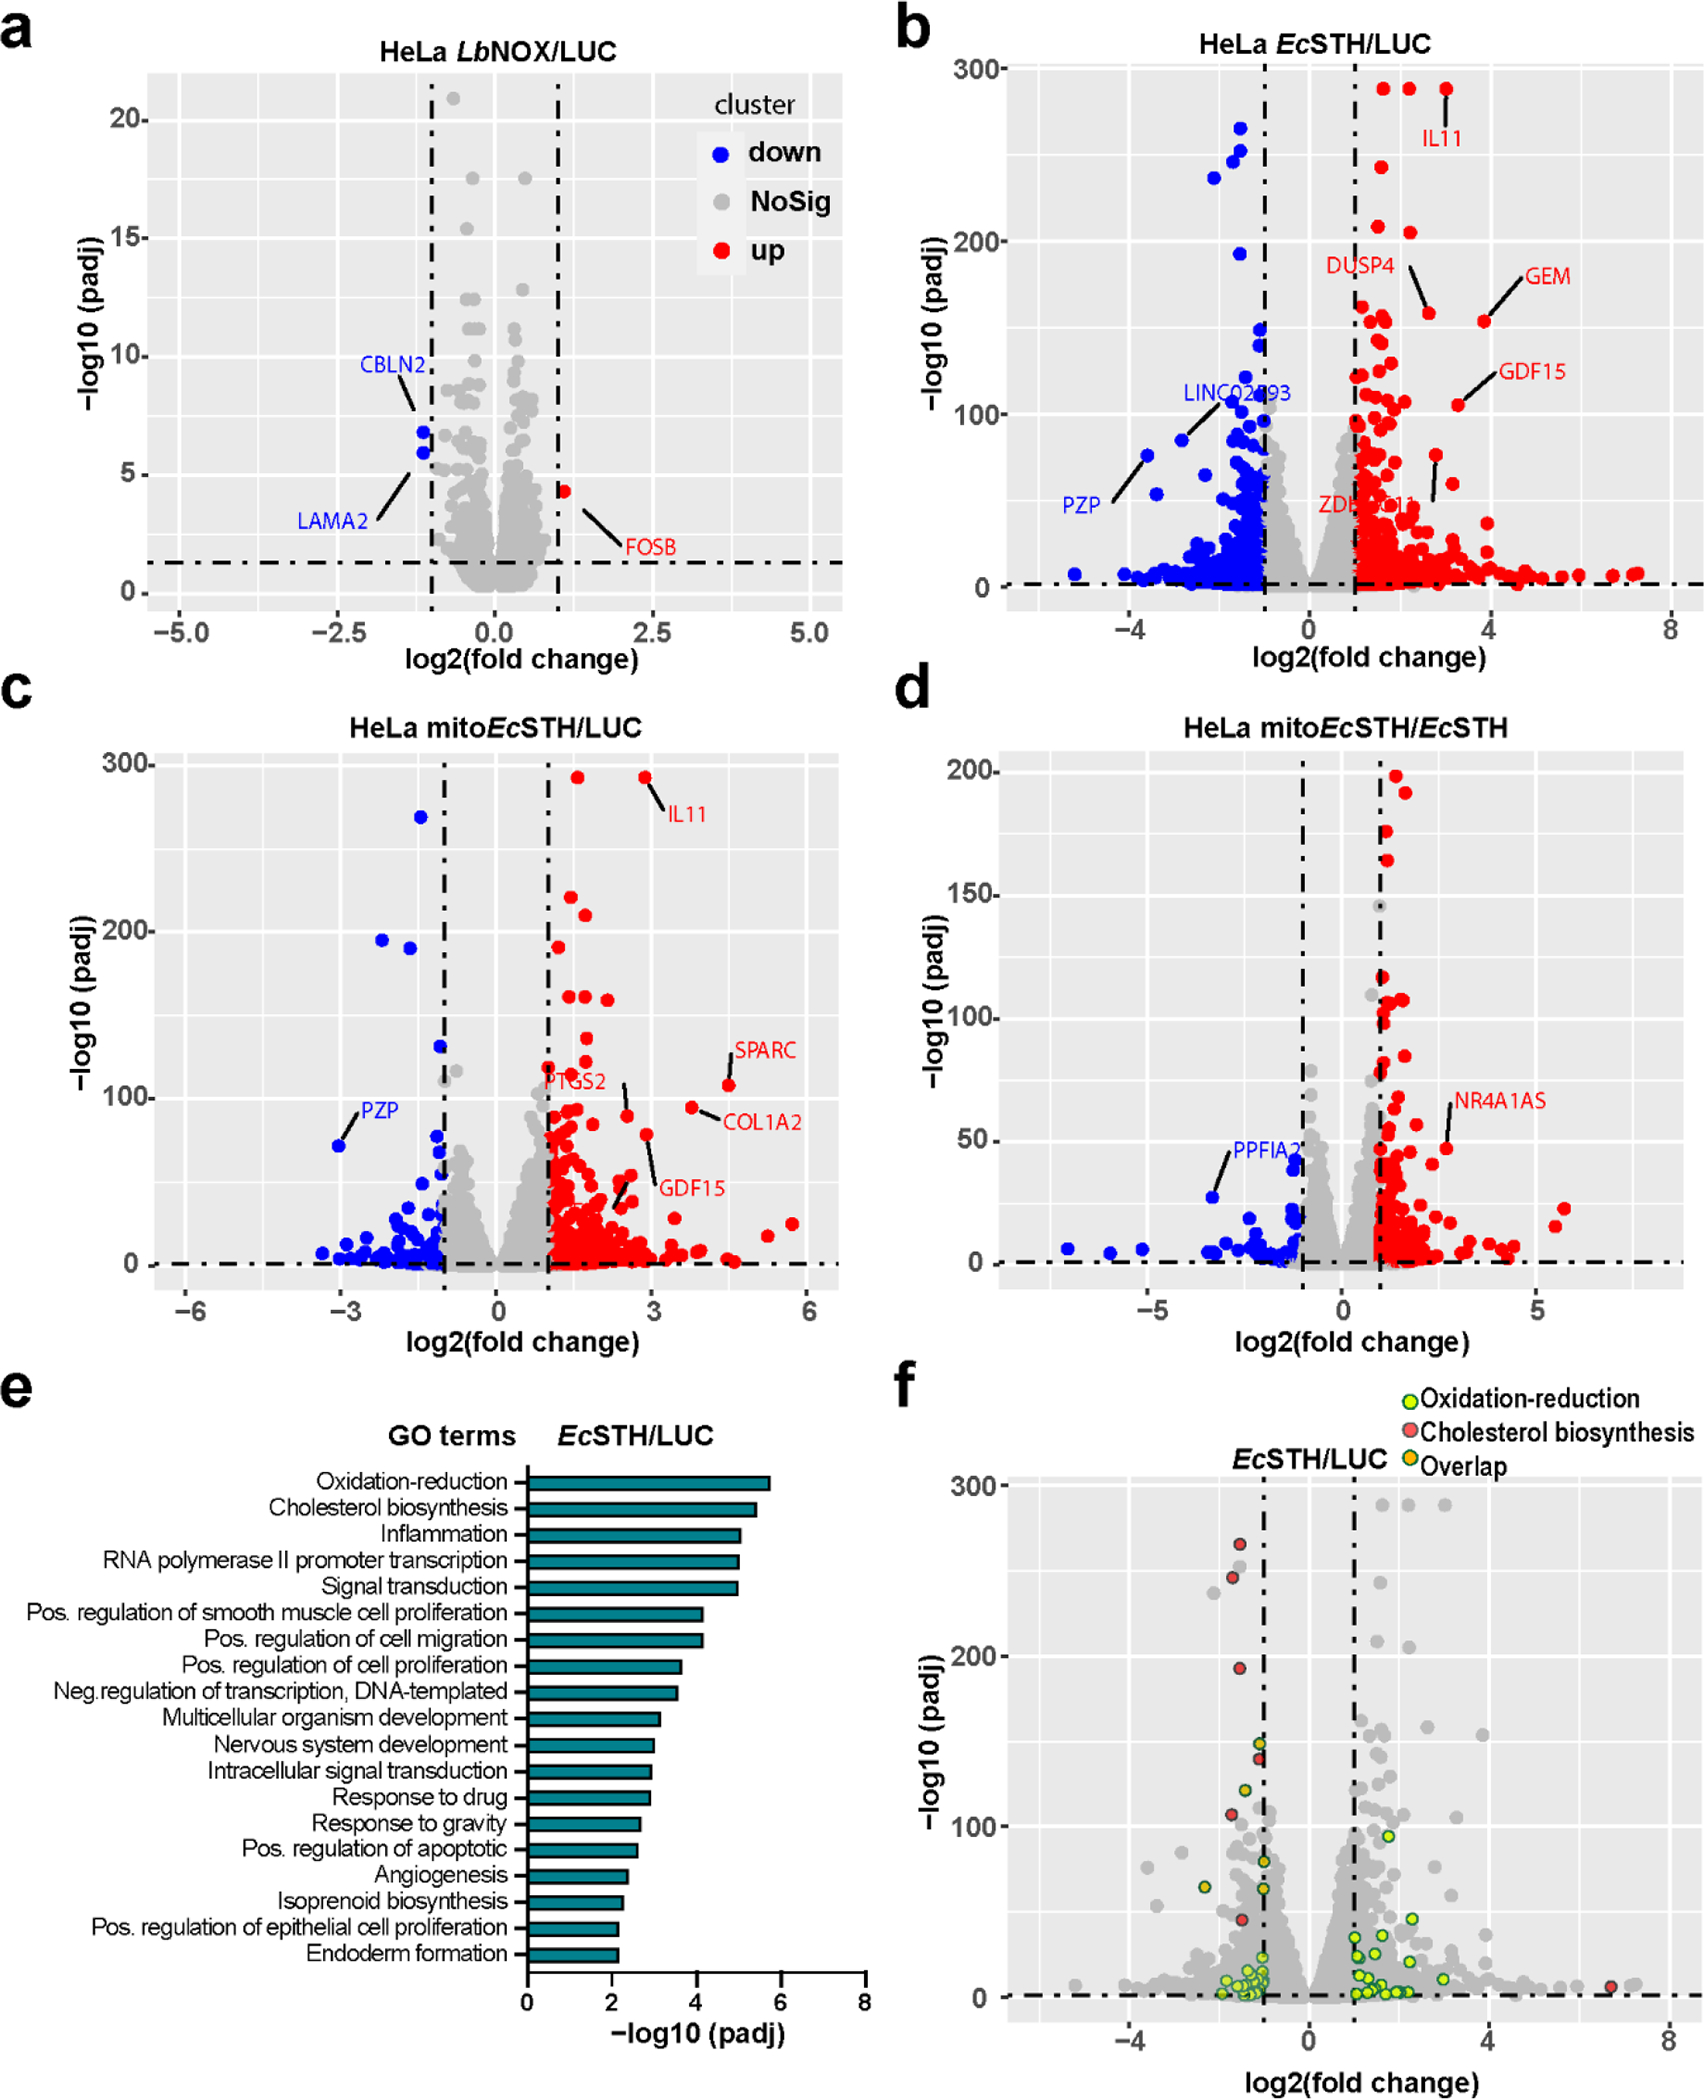
Figure 4. RNA-Seq of HeLa cells expressing LbNOX, EcSTH and mitoEcSTH.

(a-d) Volcano plots that represent the indicated group’s log2 fold change (x-axis) and adjusted P-value for significance (y-axis). Genes significantly different in expression at FDR 5% are indicated in red (up-regulated genes) and blue (down-regulated genes). Gray dots represent genes without significant changes in expression. Selected genes are marked with gene names. (e) Gene ontology enrichment analysis of EcSTH vs LUC control group. (f) Volcano plot representing the top 2 GO terms in (e). Light green dots represent the “oxidation-reduction” and salmon dots represent the “cholesterol biosynthetic” pathways. Overlapping genes are highlighted in orange.
