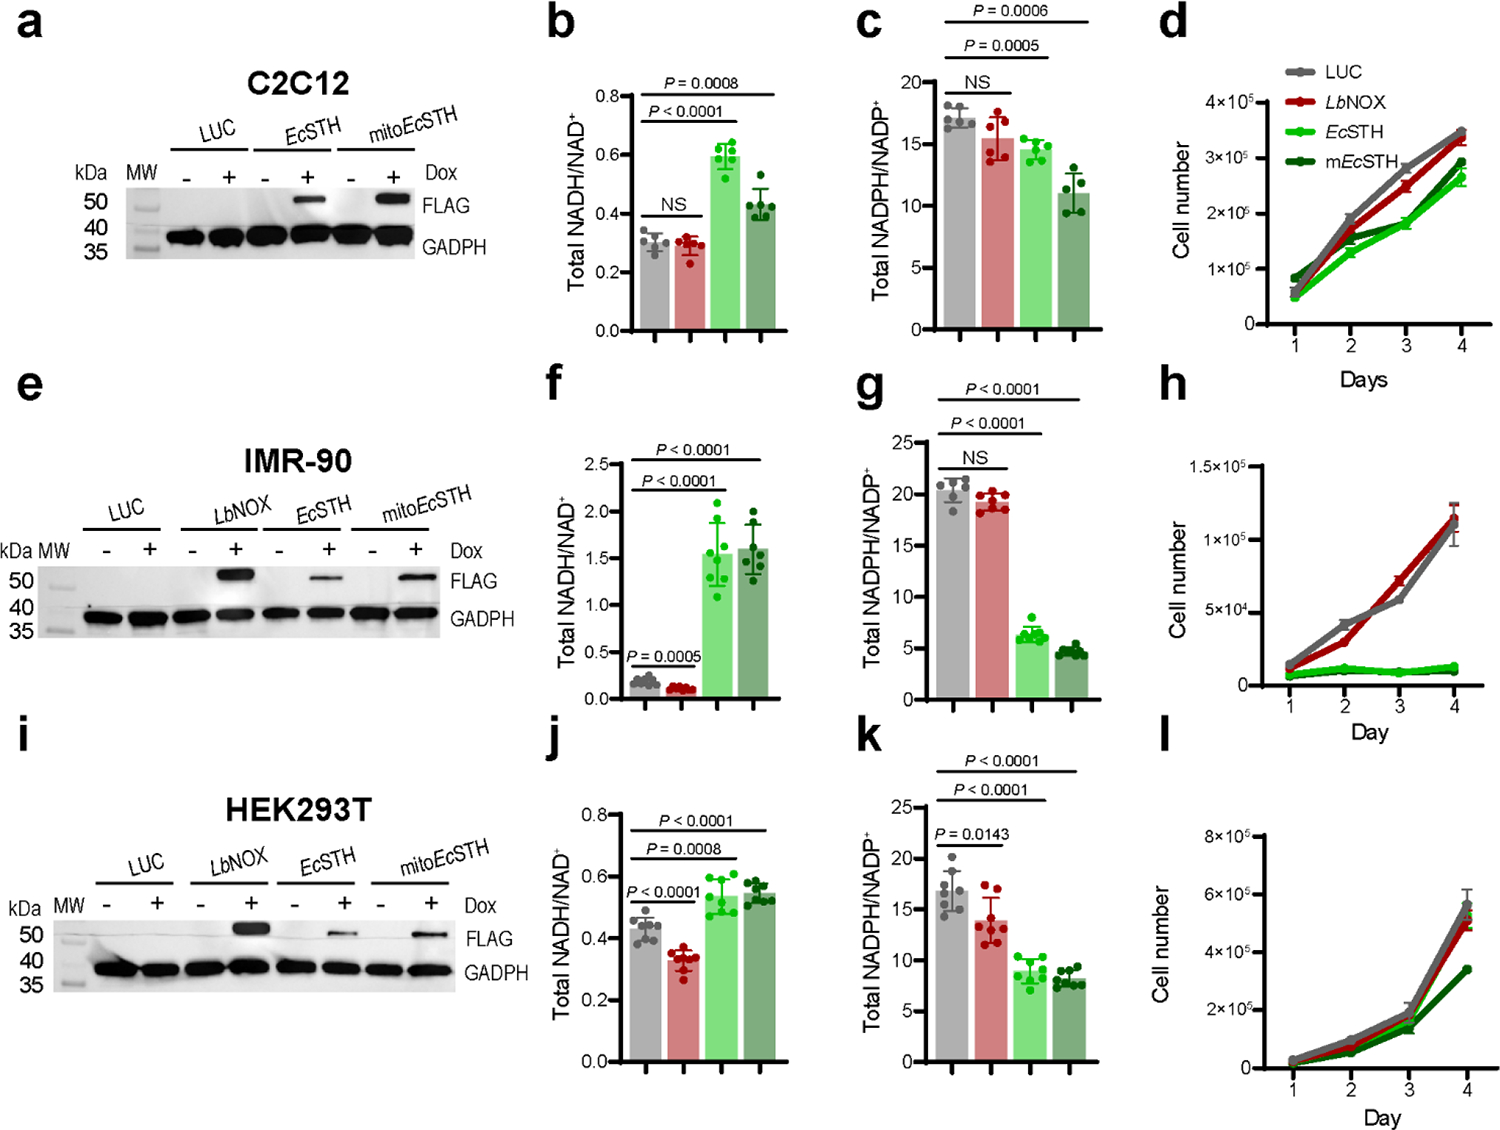
Figure 5. The anti-proliferative effect of EcSTH and mitoEcSTH expression is cellular background specific.

Western blot analysis of EcSTH and mitoEcSTH expression in C2C12 mouse myoblasts (a), IMR-90 human fibroblasts (e), embryonic human kidney HEK293T cells (i). (a, e, i) Representative blots are shown. The total NADH/NAD+ ratios in C2C12 myoblasts (b), IMR-90 (f), HEK293T (j) cells expressing EcSTH and mitoEcSTH. The total NADPH/NADP+ ratios in C2C12 myoblasts (c), IMR-90 (g), HEK293T (k) cells expressing EcSTH and mitoEcSTH. Proliferation of C2C12 myoblasts (d), IMR-90 (h), HEK293T (l) cells expressing EcSTH and mitoEcSTH in pyruvate-free DMEM+dFBS. LUC and LbNOX expressing HeLa cells were used as controls in (a-l). Values are mean ± s.d.; n = 6, 6, 6, 6 in (b), n = 6, 6, 6, 5 in (c), n = 8, 8, 8, 7 in (f), n = 6, 7, 8, 8 in (g), n = 8, 8, 8, 8 in (j), n = 8, 8, 8, 8 in (k) biologically independent samples. The statistical significance indicated for (b, c, f, g, j, k) represents a Welch ANOVA followed by unpaired t test. NS, no significant difference. For growth curves (d, h, l) error bars represent mean ± s.d.; n = 3 biologically independent samples.
