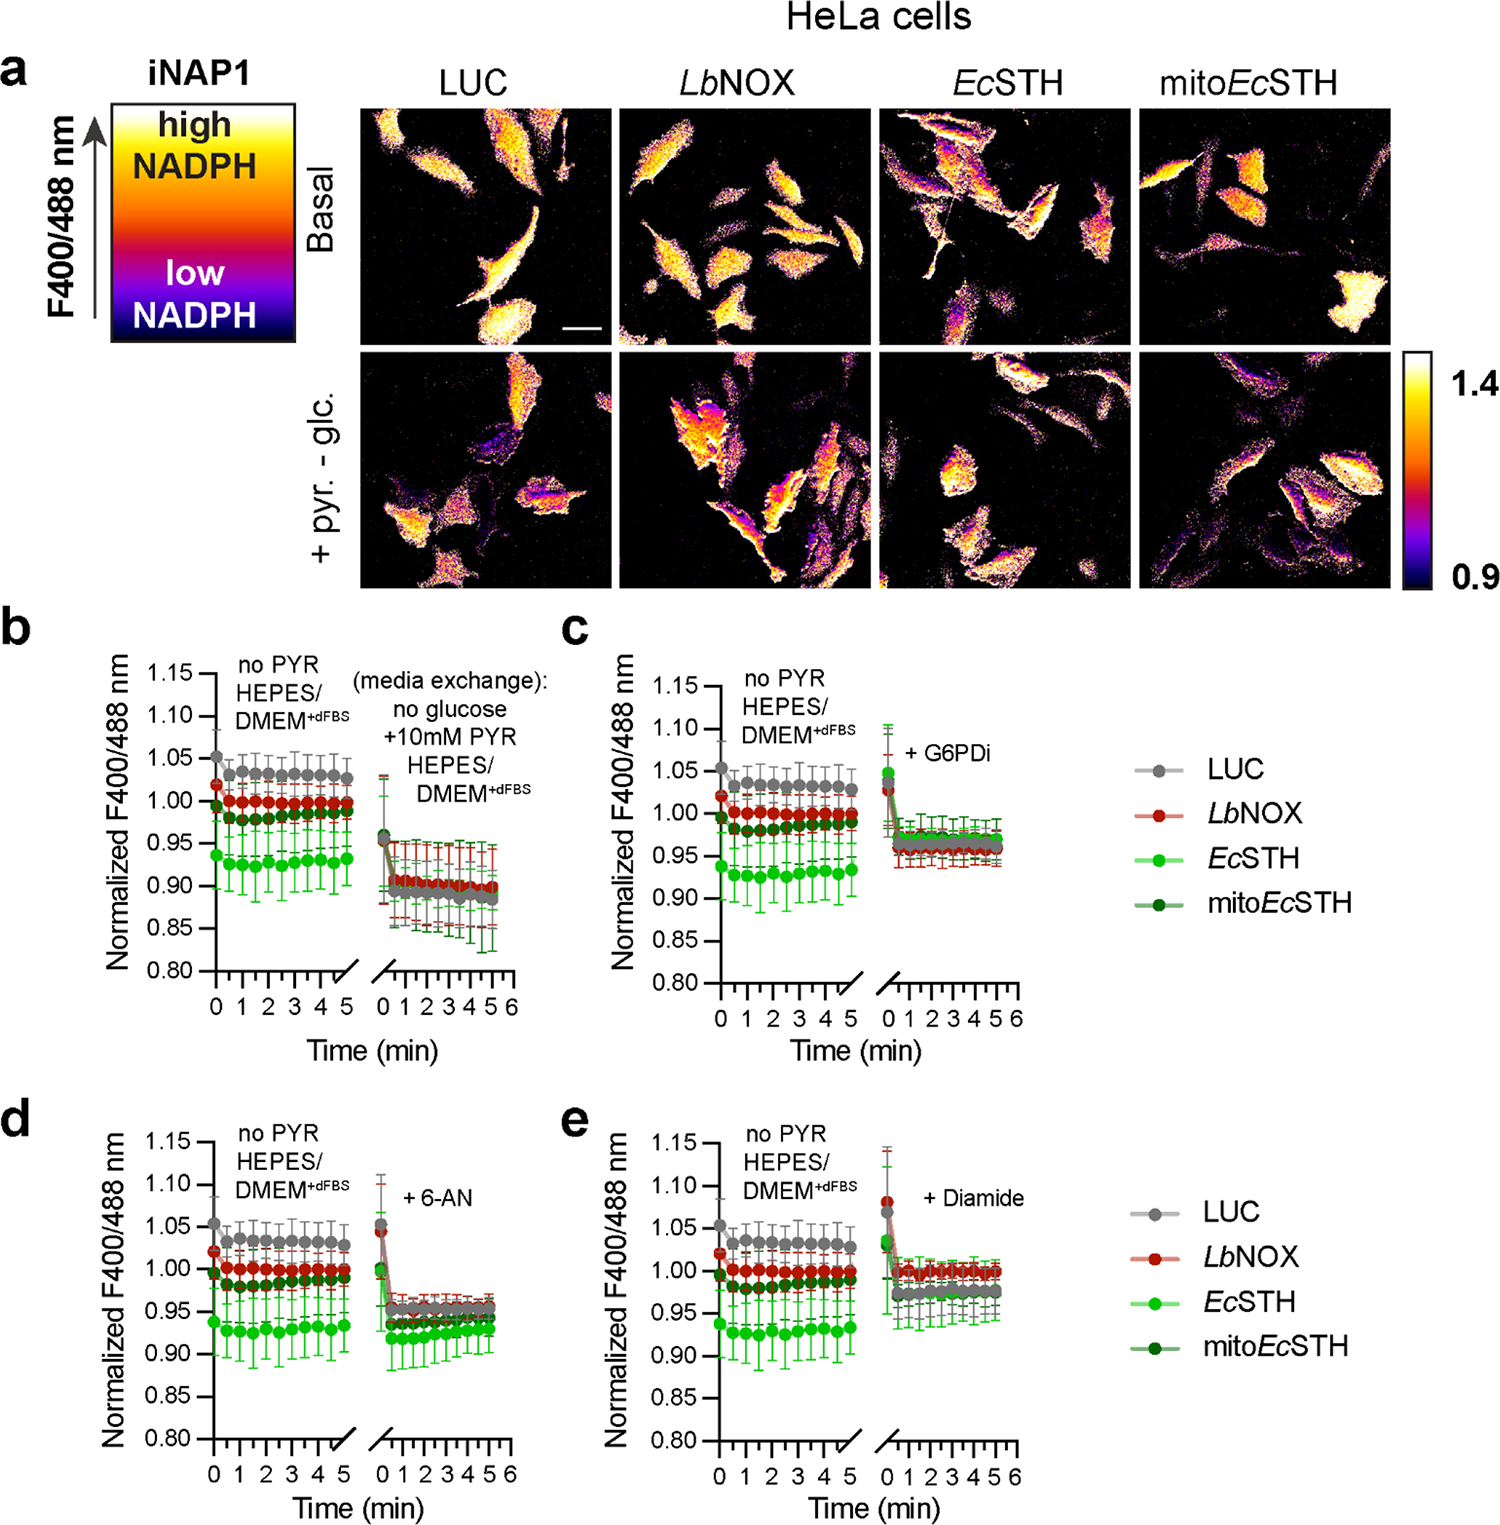
Extended Data Fig. 2.

(a) Left panel is a schematic representation of principle of live cell imaging using genetically encoded biosensor iNAP1. The fluorescence intensity of the iNAP1 channel is represented in pseudocolor. The ratio of fluorescent intensities from excitations at 400 and 488 reflects cellular levels of NADPH. High F400/488 ratio corresponds to high NADPH and vice versa. To the right are widefield images of HeLa cells with lentivirus mediated LUC, LbNOX, EcSTH, mitoEcSTH expression under Dox control transiently expressing iNAP1, in basal medium (DMEM without pyruvate, fluorescent vitamins and phenol red with 5 mM glucose, 25 mM HEPES, pH 7.4 and 1% dialyzed FBS), or when cells were switched to the basal medium without glucose but with 10 mM pyruvate. Scale bars: 50 μm. Quantification of the time course measurements of the fluorescence ratio (F400/488) for HeLa cells with lentivirus mediated LUC, LbNOX, EcSTH, mitoEcSTH expression under Dox control transiently expressing iNAP1 in the basal medium followed by replacement with basal medium without glucose but with 10 mM pyruvate (b), after addition of G6PDi (c), after addition of 6-AN (d), or after addition of diamide (e). Values are mean ± s.d.; n = 9, 8, 8, 8 in (b), n = 8, 8, 8, 8 in (c), n = 8, 8, 8, 8 in (d), n = 8, 9, 7, 8 in (e) biologically independent samples.
