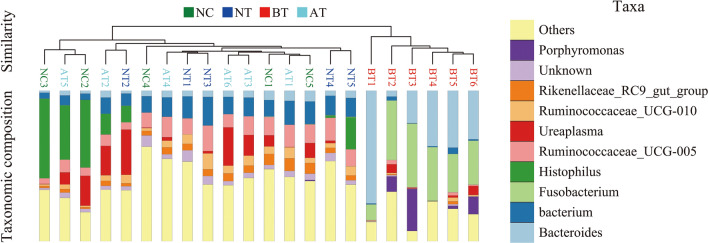
Figure 4.
Bacterial beta diversity based on UPGMA clustering and abundances of the top 10 genera. To optimize the view, the histogram shows only the top 10 most abundant genera; the other genera are merged in an “others” category. “unknown” represents a species that are not annotated with taxonomy. Closer samples with shorter branch lengths have more similar genus-level compositions. Each color represents a genus, and the length of the patch represents the relative abundance ratio of all the bacterial communities in each sample.

