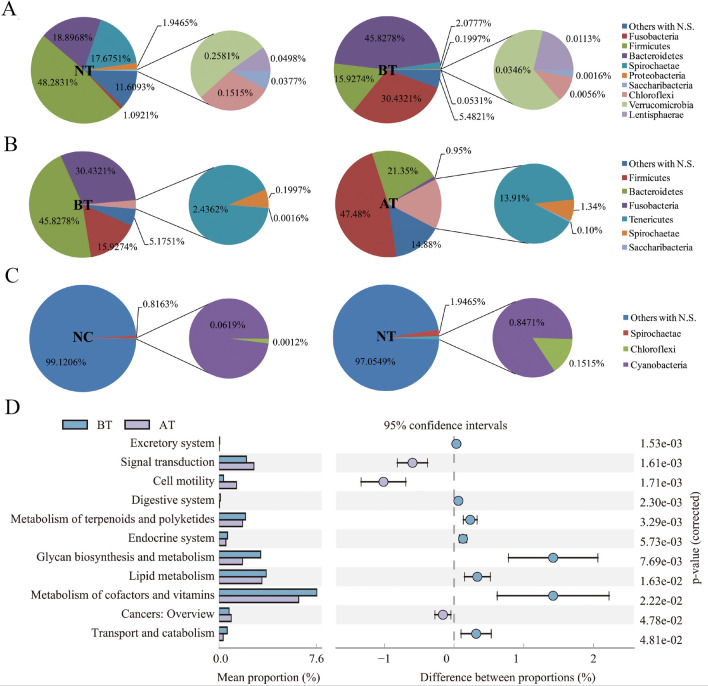
Figure 6.
Abundances of bacterial communities changes at phylum level and related metabolic pathways with OTC treatment. (A–C) Relative abundances of bacterial phyla in four groups. Each color represents a phylum. No significantly changed phyla are merged in an “Others with N.S.” category. (D) KEGG pathways associated with significantly different abundances in the bacterial metagenomics profiles of BT and AT groups. The bars represent the proportion of each category in the data. Category differences with a P < 0.05 were considered to be significant.

