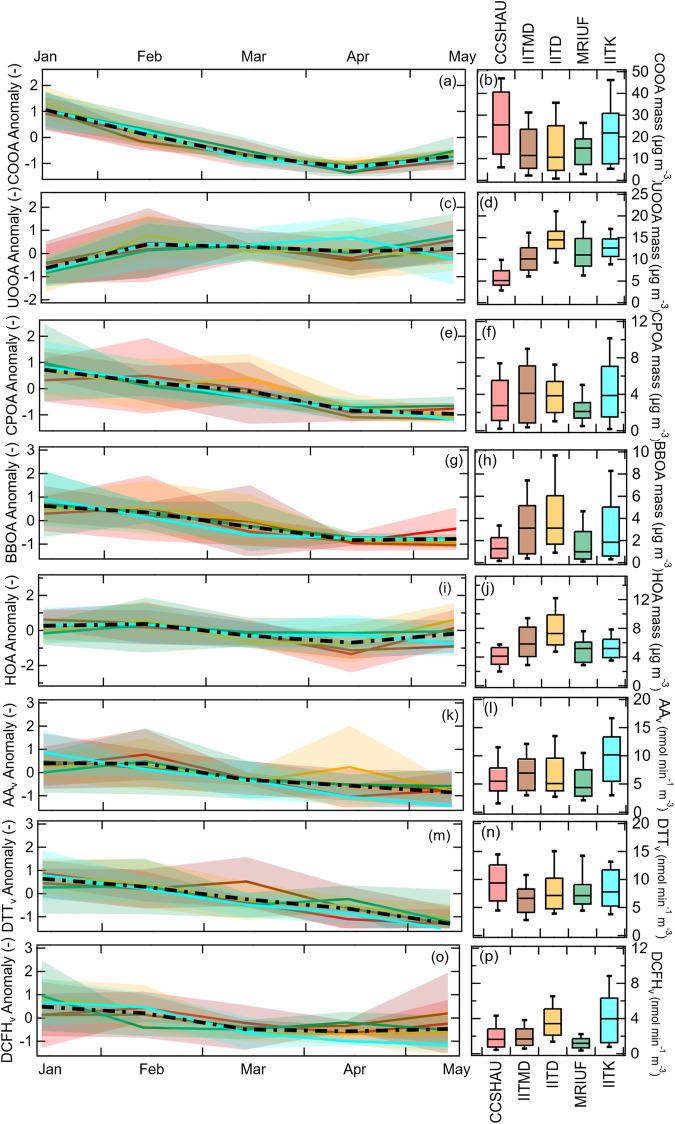
Fig. 3. Spatial and temporal variation in organic aerosol (OA) sources and oxidative potential (OP).
Standardized monthly variation of OA sources and OP per unit volume of air, OPv for five sites (a, c, e, g, i, k, m, o). The temporal anomaly (y-axis) for each sampling site was calculated from 9-12 (Jan), 8-9 (Feb), 5-6 (Mar), 5 (Apr), and 5 (May) daily samples as: ((absolute value – temporal site average (μ))/temporal site standard deviation (σ)). The colored solid lines and corresponding shaded area represent site-specific temporal anomaly and its ±1σ. A thick black dashed line represents the overall averaged spatial variation. The absolute values of the same parameters are shown as box whisker plots [line/box: median and 25th-75th percentile; upper and lower end of whisker: 10th-90th percentile] in (b, d, f, h, j, l, n, p).

