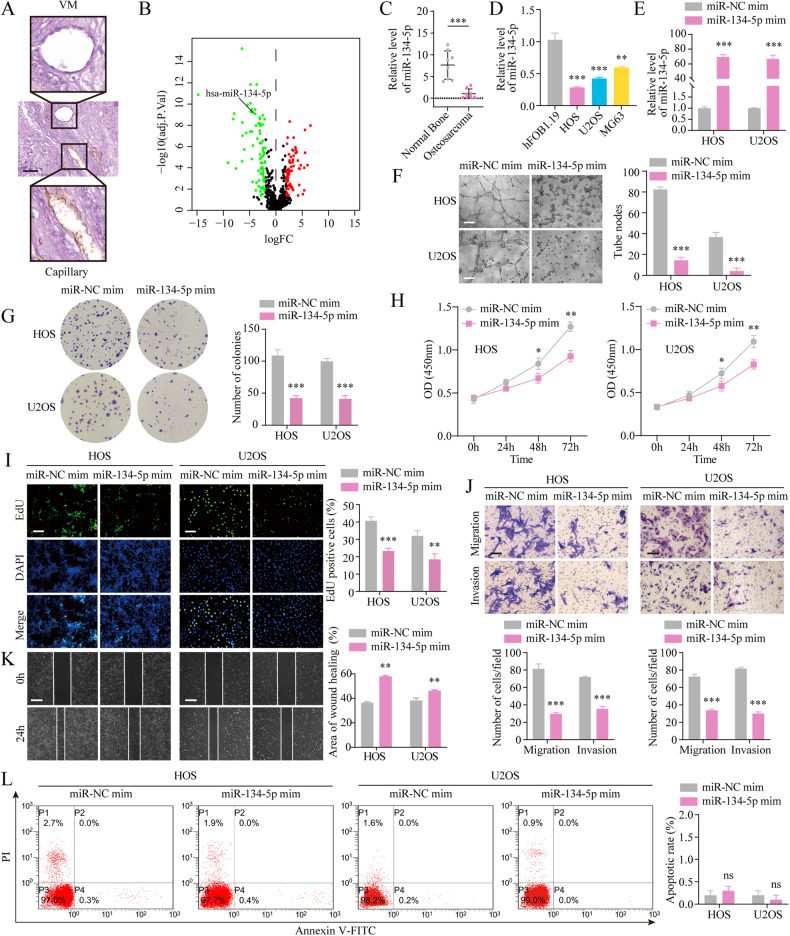
Fig. 1. miR-134-5p mimic blocks VM, proliferation, migration, and invasion in OS.
A CD31/PAS double-staining showing immunohistochemical staining for VM in OS. (Scale bar, 50 μm). B Gene expression profiles of GSE28423 are shown as volcano plots. Upregulated DEGs are represented in red and downregulated DEGs are represented in green. C Reduced miR-134-5p levels in OS tissue (n = 8) vs normal bone (n = 8), shown by qRT-PCR. Statistics using independent Student’s t-test. D Decreased miR-134-5p levels in OS cells versus osteoblasts. E Expression of miR-134-5p in transfected cells, shown by qRT-qPCR. F Tube formation assays to assess effects of the miR-134-5p mimic on VM. Scale bar, 200 μm. G–I Colony formation, CCK-8, and EdU assays (scale bar, 400 μm) to evaluate the effects of the miR-134-5p mimic on cell proliferation. J Transwell assays to evaluate the effects of the miR-134-5p mimic on cell migration and invasion. Scale bar, 100 μm. K Wound-healing assays to evaluate the effects of the miR-134-5p mimic on migration. Scale bar, 100 μm. L Flow cytometry to evaluate the effects of the miR-134-5p mimic on apoptosis. The data represent means ± SD. Statistics using one-way ANOVA with Tukey’s test. ns not significant; *p < 0.05; **p < 0.01; ***p < 0.001.

