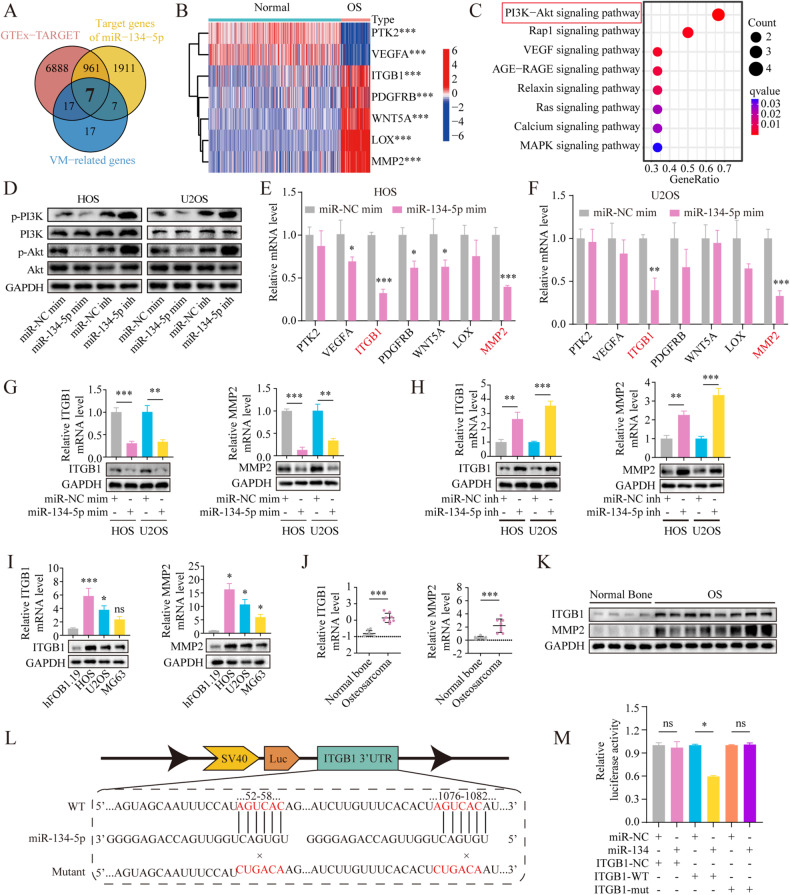
Fig. 2. Identification of miR-134-5p target genes in OS.
A The Venn diagram shows the intersection of three sets: 48 VM-associated genes, 2886 predicted miR-134-5p target genes, and 7873 DEGs. B Heatmap showing expression of seven genes between OS and control tissue in the GTEx-TARGET cohort. C KEGG enrichment analysis of the seven candidate miR-134-5p target genes. D Protein levels of p-PI3K, PI3K, p-Akt, and Akt in OS cells following transfection with the miR-134-5p mimic or miR-134-5p inhibitor or the corresponding negative control. E, F mRNA expression of seven candidate genes in cells transfected with the miR-134-5p mimic. G Protein and mRNA levels of MMP2 and ITGB1 in miR-134-5p mimic-transfected OS cells versus control. H Protein and mRNA levels of MMP2 and ITGB1 in miR-134-5p-knockdown OS cells versus control. I Protein and mRNA levels of MMP2 and ITGB1 in OS cells versus osteoblasts. Statistics using one-way ANOVA with Tukey’s test. J, K Protein and mRNA levels of MMP2 and ITGB1 in OS tissues versus normal bone. Statistics using independent Student’s t-test. L Wild-type and mutant binding sites for ITGB1 in miR-134-5p. M Luciferase assay of HOS cells transfected with miR-134-5p mimic (10 nM) or control miR-NC and plasmids containing 3′ UTRs of ITGB1. Statistics using one-way ANOVA with Tukey’s test. The data represent means ± SD. ns not significant; *p < 0.05; **p < 0.01; ***p < 0.001.

