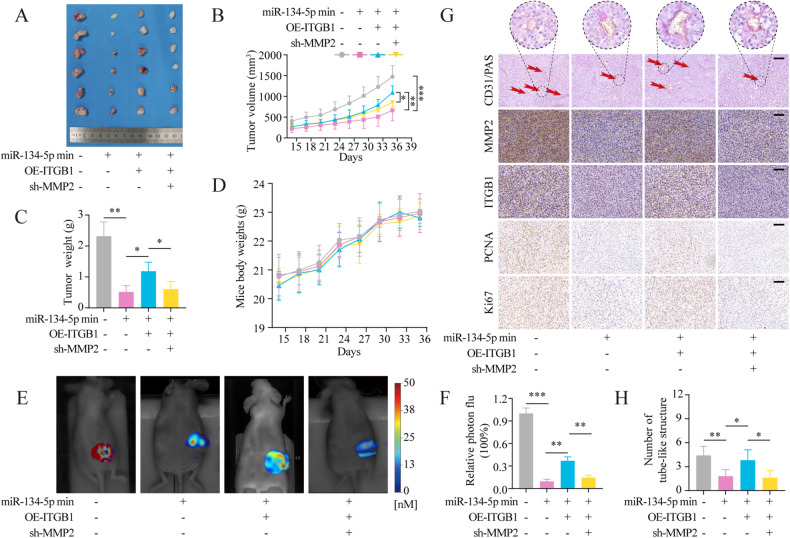
Fig. 6. Loss-of-function analyses verifying the involvement of the miR-134-5p/ITGB1/MMP2 axis in mouse xenograft tumor proliferation and VM.
A Tumor images. B Tumor volumes. C Tumor weights. D Mice body weights. E, F Bioimaging of tumors using fluorescence molecular tomography and MMPSense 680 to quantify MMP activity in tumors. G, H Immunohistochemical staining of tumors; the red arrow indicates the VM. Scale bar, 100 μm. Statistics using one-way ANOVA with Tukey’s test. The data represent means ± SD. *p < 0.05; **p < 0.01; ***p < 0.001.

