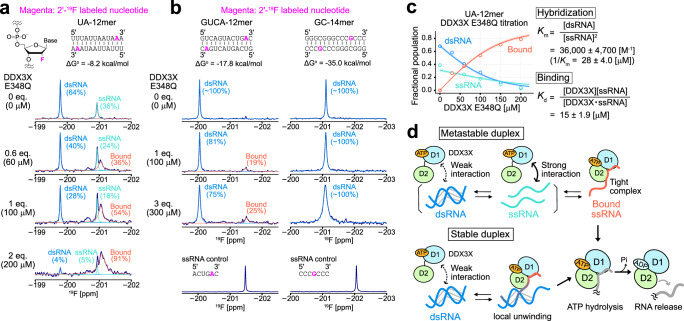
Fig. 4. 19F NMR analyses of RNA.
19F 1D spectra of UA-12mer (a), GUCA-12mer (b, left), and GC-14mer (b, right) in the presence of varying concentrations of the E348Q variant of DDX3X in the ATP-bound form are shown. The experimentally obtained spectra are shown as navy lines, and deconvoluted lines of dsRNA (blue), ssRNA (turquoise), and bound (orange-red) signals are overlayed. The 19F NMR spectra of control ssRNA for GUCA-12mer and GC-14mer are shown below. Duplex stability (ΔGo) at 30 °C (for UA-12mer) or 35 °C (for GUCA-12mer and GC-14mer) was estimated by using nearest-neighbor parameters in 1 M NaCl49,50. All NMR measurements were performed at 30 °C (for UA-12mer) or 35 °C (GUCA-12mer and GC-14mer), 600 MHz. RNA concentration was 100 μM (as a single strand). c Plots of the fractional populations of free dsRNA (blue), free ssRNA (turquoise), and bound ssRNA (orange-red) states as a function of DDX3X E348Q concentration. Lines represent the best-fit curves, and a 95% confidence interval of each fitted curve is contained within the thick line. The center of the error band represents the best-fit curve. The definition and best-fit value of the equilibrium constants are also displayed. d Cartoon representations of the interaction between each RNA ligand and DDX3X are shown. Source data are provided as a Source Data file.

