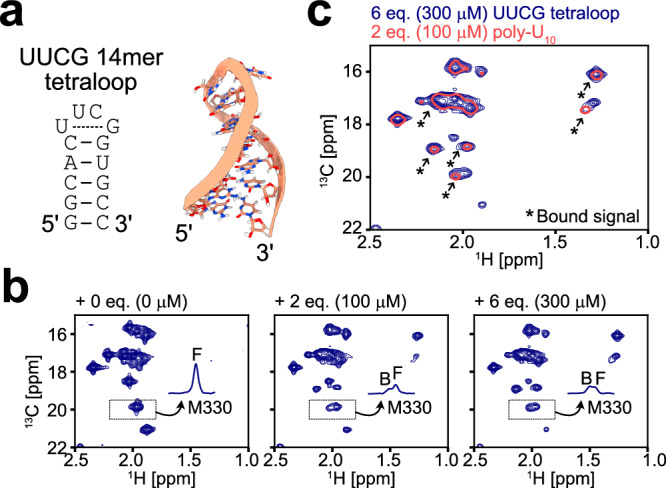
Fig. 5. UUCG tetraloop titration experiments.

a Secondary structure (left) and NMR three-dimensional structure (right) of the 14mer UUCG tetraloop (PDB ID: 2KOC)53. b 13C-1H HMQC spectra of [Frac-2H; Ileδ1-13C1H3; Metε−13C1H3]-labeled DDX3X E348Q in the presence of varying concentrations of the 14mer UUCG tetraloop. The 1D projections of the dotted region containing the free (F) and bound (B) signals for M330 are shown in each spectrum. c Overlay of the spectra of DDX3X measured with 2 equimolar poly-U10 (coral, single contour) or 6 equimolar UUCG tetraloop (navy, multiple contours) is shown. The newly appeared bound state signals are highlighted by arrows. All NMR measurements were performed at 35 °C and 600 MHz, and the protein concentration was 50 μM.
