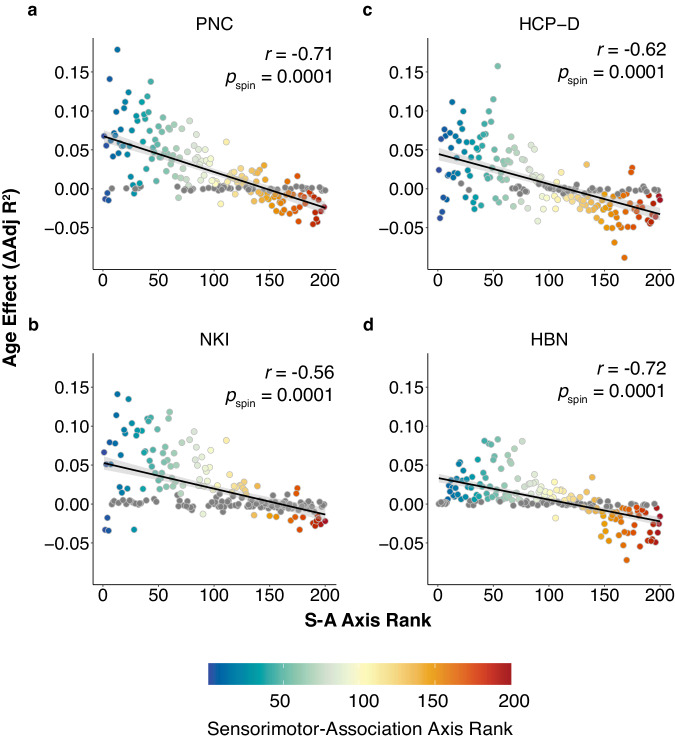
Fig. 3. Development of functional connectivity aligns with the sensorimotor-association axis.
a The rank of each region on the S-A axis explains the majority of variance in age effects in the Philadelphia Neurodevelopmental Cohort (PNC; r = −0.71, pspin = 0.0001. These findings are replicated in additional independent datasets, including (b) Nathan Kline Institute-Rockland Sample (NKI; r = −0.56, pspin = 0.0001), (c) Human Connectome Project: Development (HCP-D; r = −0.62, pspin = 0.0001), and (d) Healthy Brain Network (HBN; r = −0.72, pspin = 0.0001). The age effect of FC strength for each region (Schaefer 200) is plotted against the given region’s rank on the S-A axis. Regions that do not display significant change in FC strength over development are colored in gray (QFDR > 0.05) and were included in the correlation. Spearman’s rank correlations were used to quantify the association between S-A axis ranks and observed developmental effects, with statistical significance determined using spin-based spatial permutation tests. Source data are provided as a Source Data file.

