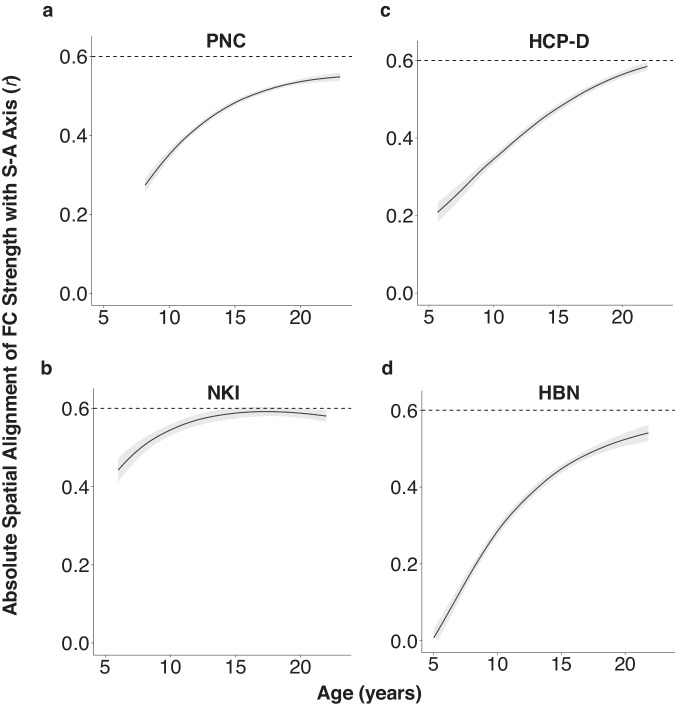
Fig. 4. The spatial distribution of functional connectivity strength increasingly aligns with the sensorimotor-association axis with age.
An age-resolved analysis reveals that variation in regional FC strength becomes more aligned with the S-A axis over the course of development. Plots show age-specific correlation values between FC strength and S-A axis ranks across regions, which converge to a strong absolute correlation of approximately 0.6 by early adulthood. a Across regions, the absolute correlation between fitted FC strength and S-A axis ranks strengthens from age 8 to 22 in the PNC. This increase in spatial alignment is replicated in (b) NKI (ages 6-22), (c) HCP-D (ages 5-22), and (d) HBN (ages 5–22). Model-predicted values of functional connectivity strength were generated from regional GAMs at 1-month intervals between the youngest and oldest ages in each dataset. Reliable estimates of the correlation value at each age were obtained by sampling 10,000 draws from the posterior fitted FC strength value predicted by each region’s GAM smooth function. We computed age-specific correlations between fitted FC strength values across regions and S-A axis ranks for all 10,000 draws. The median correlation value (r) computed across all draws is represented by the black line. The 95% credible interval around the median correlation value is shown in the gray band. Source data are provided as a Source Data file.

