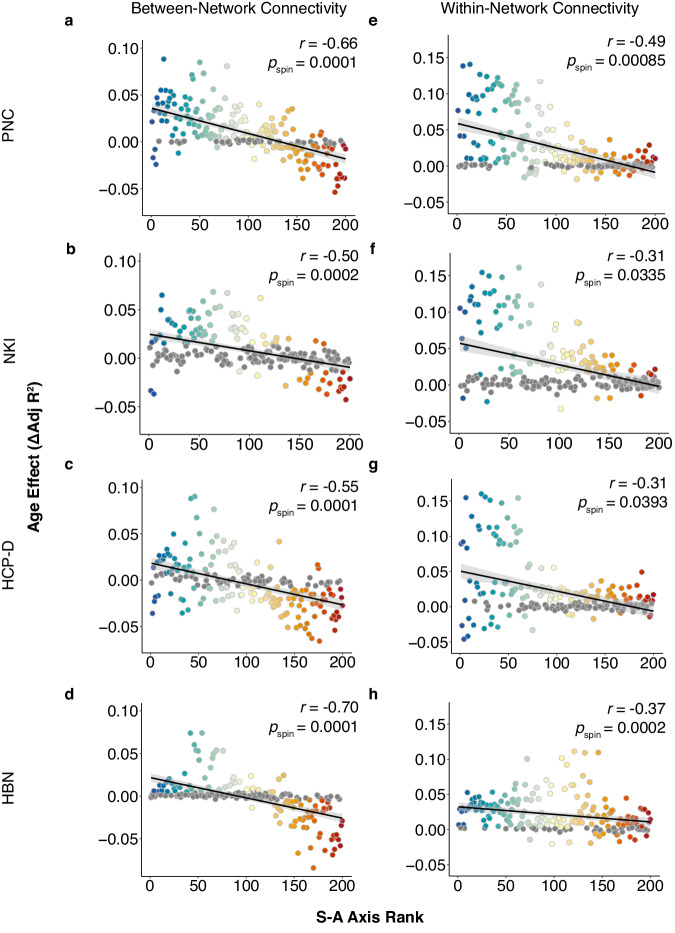
Fig. 5. Hierarchical developmental change in average between-network and within-network connectivity.
Regional development of average between-network connectivity and average within-network connectivity varies along the S-A axis. a–d The age effect of average between-network connectivity is highly aligned with the S-A axis in all four datasets (PNC: r = −0.66, pspin = 0.0001; NKI: r = −0.50, pspin = 0.0002; HCP-D: r = −0.55, pspin = 0.0001; HBN: r = −0.70, pspin = 0. 0001). e–h The age effect of average within-network connectivity is aligned with the S-A axis in PNC (r = −0.49, pspin = 0.00085) and in replication datasets (NKI: r = −0.31, pspin = 0.0335; HCP-D: r = −0.31, pspin = 0.0393; HBN: r = −0.37, pspin = 0.0002), but not as strongly. Results are shown in the Schaefer 200 atlas with 7-network partition based on the 7 Yeo network solution13,40. Colors correspond to the rank of a given region along the S-A axis. Spearman’s rank correlations were used to quantify the association between S-A axis ranks and observed developmental effects, with statistical significance determined using spin-based spatial permutation tests. Note that axes were adjusted to best visualize all datasets. A total of four data points across all datasets were excluded for between-network connectivity and a total of four data points across all datasets were excluded for within-network connectivity. Source data are provided as a Source Data file.

