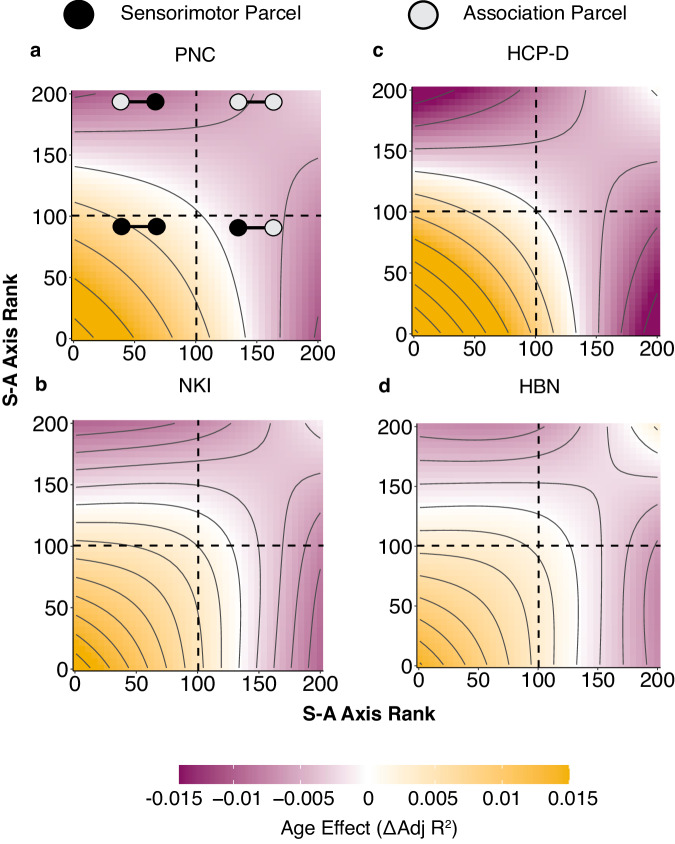
Fig. 6. Edge-level age effects confirm divergent connectivity refinement along the sensorimotor-association axis.
a–d Topographical plots display edge-level connectivity age effects as a function of S-A axis rank. Colors indicate the magnitude and direction of the age effect at each region-to-region connection. Contour lines indicate a constant age effect. Sensorimotor-to-sensorimotor connections (bottom left of each plot; yellow) display strong increases in connectivity. Connections between middle-axis regions (middle of the figure; white or light purple) demonstrate lack of change or modest decreases in connectivity. Sensorimotor-to-association connections (top left and bottom right; dark purple) show strong decreases in connectivity. Association-to-association connections (top right; light purple) also moderately weaken in development. Note that plots display the age effect of edges rather than of regions. Source data are provided as a Source Data file.

