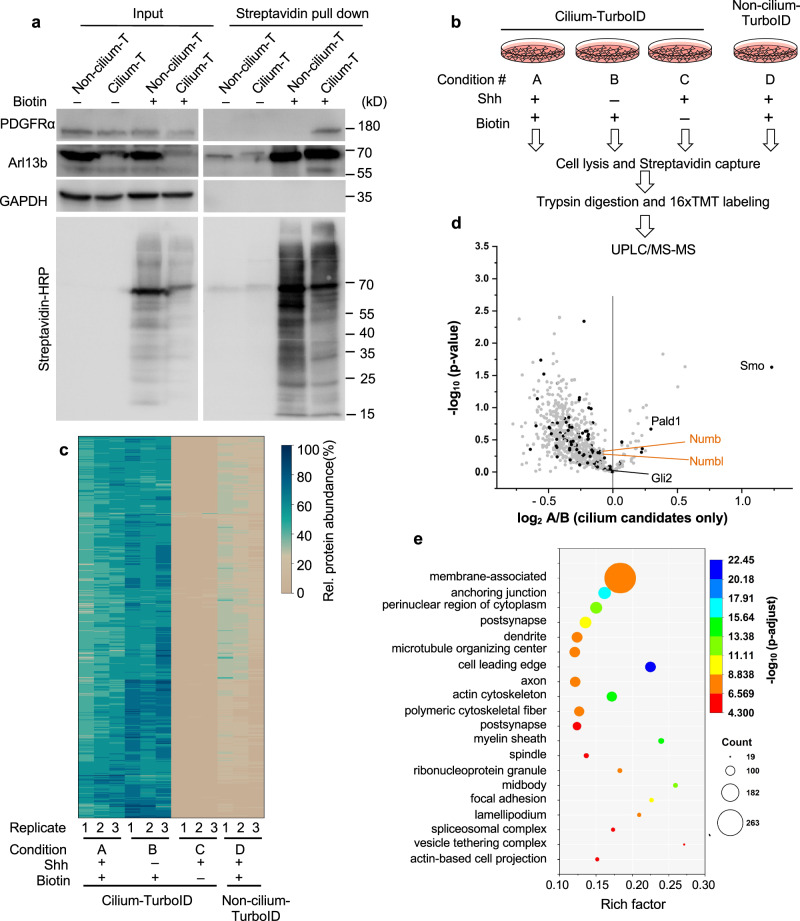
Fig. 2. Quantitative proteomics with cilium-TurboID identified novel ciliary proteins.
a Biotinylated proteins from cell lysates of cilium-TurboID and non-cilium-TurboID cells were isolated by streptavidin beads and analyzed by Western blotting. The overall biotinylated proteins were detected by streptavidin-HRP. PDGFRα is a receptor known to localize to the cilium. In the Arl13b blot, the bands at 70kD represent the transgene, and the bands at 55 kD represent endogenous Arl13b. Experiments were performed three times with similar results. b Design and workflow of the cilium proteomics experiment. Samples were prepared in triplicate. After TMT labeling, all samples were pooled together before being fractionated by UPLC and analyzed by mass spectrometry. c Heatmap of the ciliary abundance of the 800 ciliary candidates. Clustering of the relative abundances of each identified protein (rows) in individual samples (columns) was performed based on Ward’s minimum variance method. The relative abundance was calculated within one set of samples that contains all four conditions. For example, A1, B1, C1, D1 belong to one set, and the relative abundance is calculated as A1/(A1 + B1 + C1 + D1) etc. The panel on the right side indicates the color scheme of relative abundances (percentage). d Volcano plot of statistical significance versus the average ratio of protein enrichment for all ciliary candidates. The ratio was calculated as TMT signal intensity of Shh-treated samples (A) compared to non-Shh treated samples (B) in the presence of biotin labeling. The analytical procedure for identifying ciliary candidates from the mass spectrometry results is described in supplementary Fig. 3. The previously reported ciliary proteins are highlighted as black dots. e GO enrichment analysis of cellular components was plotted according to the rich factor in Metascape. The top 20 enriched cellular components are represented in the scatter plot. The p values in (d) and (e) were adjusted for multiple testing via the Benjamini-Hochberg procedure. Source data are provided as a Source Data file.

