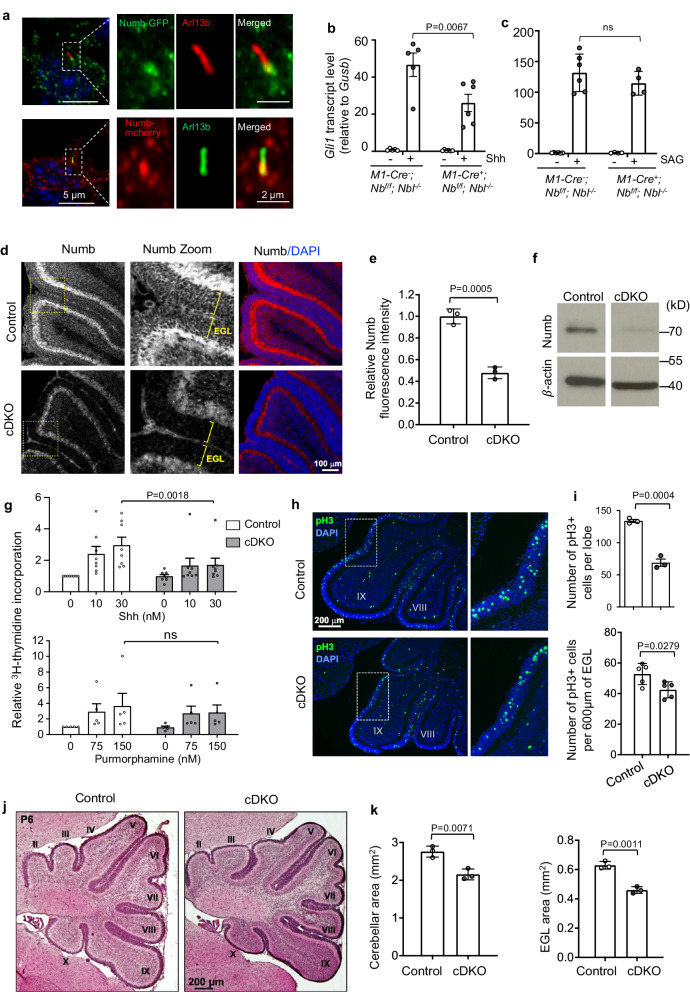
Fig. 8. Numb is required for Hh signaling and Shh-induced proliferation in GCPs.
a Numb localizes to the bottom section of the primary cilium in cultured GCPs. GCPs infected with lentivirus expressing Numb-GFP or Numb-mCherry were co-stained with Arl13b. Experiments were performed three times with similar results. b, c Hh signaling activity in GCPs isolated from P6 mice. GCPs were cultured in the presence of 1 nM Shh (b) or 150 nM SAG (c) for 20 h. mRNA was isolated and Gli1 mRNA levels were measured by qRT-PCR. n = 4–6 animals per condition. M1-Cre, Math1-Cre; Nb, Numb; Nbl, Numblike. d Sagittal sections of cerebellum from P6 control and Numb;Numbl cDKO mice immunostained for Numb. The immunofluorescence intensity of Numb in the EGL of cDKO cerebellum is lower than the control cerebellum. Boxes indicate the zoomed regions. Brackets denote the EGL. e Quantification of the mean Numb fluorescence intensity in the EGL. n = 3 cerebella per group. f Western blotting showing that Numb protein is reduced in GCPs isolated from cDKO cerebellum. g GCPs isolated from P6 cerebellum were cultured for 48 h in the presence of Shh or Purmorphamine. GCP proliferation was measured by 3H-thymidine incorporation. n = 8 experiments (Shh) and 5 experiments (Purmorphamine), and each condition included 1–5 animals. h Sagittal sections of cerebellum at the same mediolateral levels from P6 control and cDKO mice immunostained for the mitotic marker pH3. Boxes indicate zoomed regions. i Quantification of the number of pH3-positive cells in the EGL in one lobe of the cerebellum, and pH3-positive cells per 600 μm of the EGL. n = 3 or 5 cerebella per group. j Sagittal sections of cerebellum at the same mediolateral levels from P6 control and cDKO mice, stained with H&E. Roman numerals indicate lobules. k Quantification of the cerebellar area and EGL area in P6 mice measured at the same mediolateral level. n = 3 cerebella per group. All results are shown as mean ± SEM. Statistics in (e, i, k): two-tailed Student’s t-test. Statistics in (b, c, g): Two-way ANOVA. ns not significant. Source data are provided as a Source Data file.

