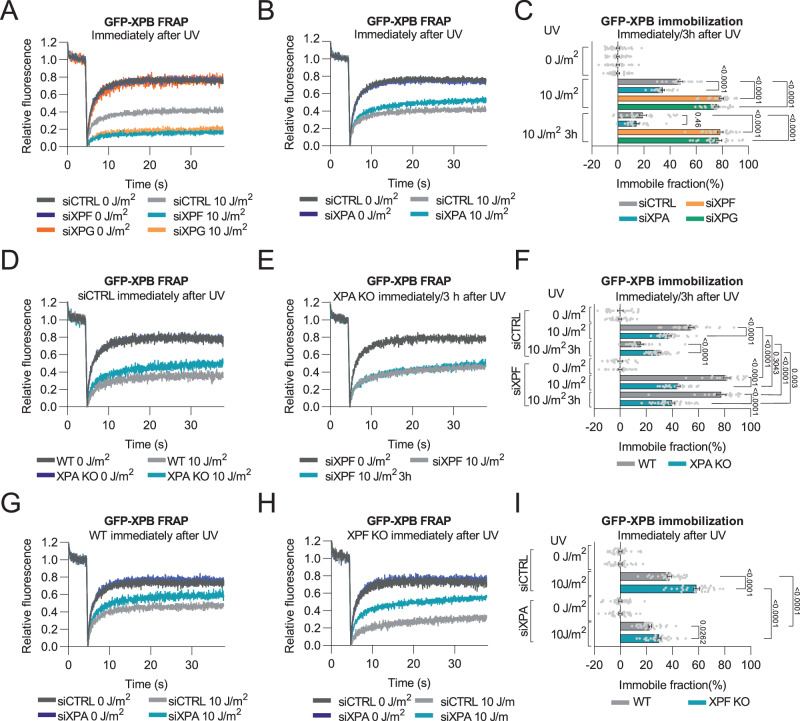
Fig. 1. TFIIH-DNA damage binding differs between XPA and XPF or XPG deficient cells.
A–C FRAP of GFP-tagged XPB and quantification of immobile fraction in MRC-5 cells treated with control (CTRL), XPF, XPG or XPA siRNA, non-irradiated (0 J/m2), immediately after (10 J/m2) or 3 h after (10 J/m2 3 h; FRAP curves shown in Supplementary Fig. 1A, C) UV-C irradiation. n = 29, 22, 26 (for siCTRL 0, 10 J/m2 and 3 h 10 J/m2); n = 30, 22, 23 (for siXPF 0, 10 J/m2 and 3 h 10 J/m2); n = 22, 24, 27 (for siXPG 0, 10 J/m2 and 3 h 10 J/m2); n = 30, 22, 19 (for siXPA, 10 J/m2 and 3 h 10 J/m2). D–F FRAP of GFP-tagged XPB and quantification of immobile fraction in wild-type (WT) and XPA knockout (KO) MRC-5 cells treated with control (CTRL) or XPF siRNA, non-irradiated (0 J/m2), immediately after (10 J/m2) or 3 h after (10 J/m2 3 h) UV-C irradiation. n = 20, 30, 22 (for WT siCTRL 0, 10 J/m2 and 3 h 10 J/m2); n = 20, 20, 20 (for WT siXPF 0, 10 J/m2 and 3 h 10 J/m2); n = 30, 30, 33 (for XPA KO siCTRL 0, 10 J/m2 and 3 h 10 J/m2); n = 30, 30, 34 (for XPA KO siXPF 0, 10 J/m2 and 3 h 10 J/m2). G–I FRAP of GFP-tagged XPB and quantification of immobile fraction in wild-type (WT) and XPF knockout (KO) U2OS cells treated with control (CTRL) or XPA siRNA, non-irradiated (0 J/m2) or immediately after 10 J/m2 UV-C irradiation. n = 30, 30 (for WT siCTRL 0 and 10 J/m2); n = 30, 30 (for WT siXPA 0 and 10 J/m2); n = 30, 30 (for XPF KO siCTRL 0 and 10 J/m2); n = 30, 30 (for XPF KO siXPA 0 and 10 J/m2). Curves are normalized to bleach depth. Each FRAP curve represents the average of at least three independent experiments. Numbers represent p-values (ANOVA corrected for multiple comparisons). Error bars represent SEM. Source data are provided as a Source Data file.

