Figure 2.
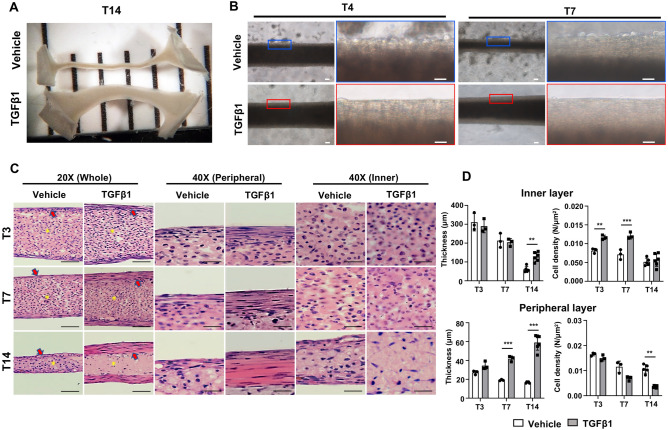
Histological analyses of the 3D tendon constructs. (A) Dissecting microscope images of 3D tendon constructs at 14 days after TGFβ1 or vehicle treatment (T14). (B) Higher magnification images of 3D tendon constructs at T4 and T7 after TGFβ1 or vehicle treatment. Scale bars in lower magnification images indicate 100 μm, and scale bars in higher magnification images indicate 50 μm. (C) H&E-stained longitudinal sections from vehicle- and TGFβ1-treated 3D tendon constructs at each stage (T3, T7, and T14). Scale bars in lower magnification images indicate 100 μm, and scale bars in higher magnification images indicate 50 μm. Yellow asterisks indicate inner layers, and red arrows indicate peripheral layers. (D) Quantification results of thickness and cell density of inner and peripheral layer (** indicates P < 0.01 and *** indicates P < 0.001, n = 3 ~ 5 constructs per group).

