Figure 4.
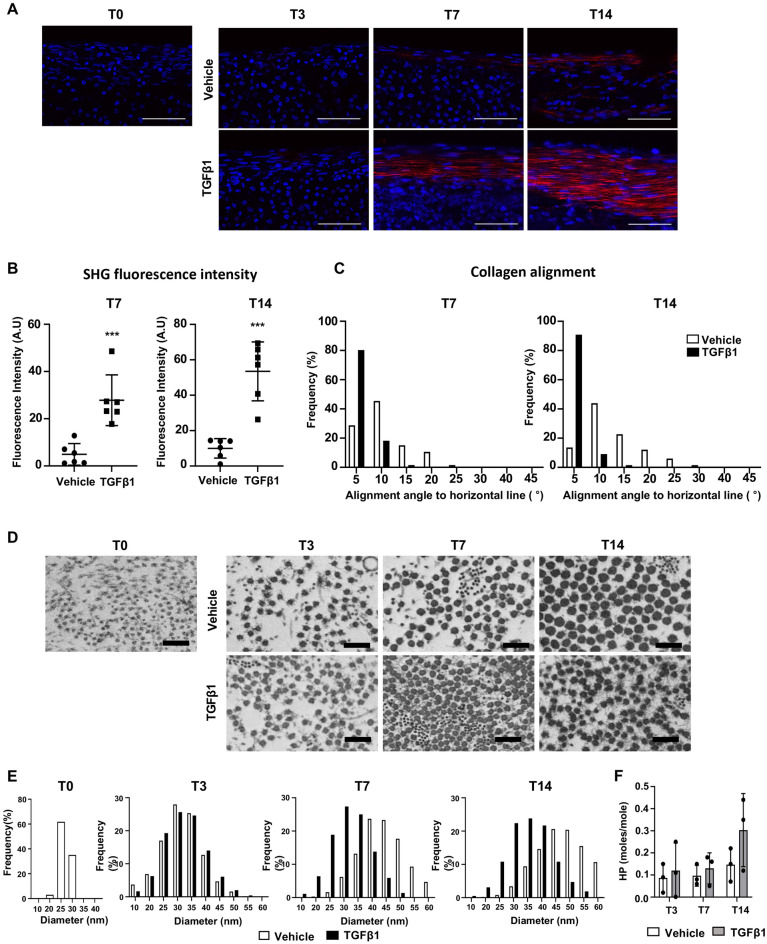
Collagen fiber formation, modification and fibrillogenesis in the 3D tendon constructs. (A) Second harmonic generation (SHG) microscopy images (collagen fiber formation) of peripheral layers of vehicle- and TGFβ1-treated 3D tendon constructs at each stage (T0, T3, T7, and T14). Scale bars indicate 50 μm. (B) Quantification of SHG signal intensity at T7 and T14 (*** indicates P < 0.001, n = 6 constructs per group). (C) Quantification of collagen fiber alignment using SHG images at T7 and T14 (n = 6 constructs per group at each stage). (D) Transmission electron microscopy (TEM) microscopy images of peripheral layers of vehicle- and TGFβ1-treated 3D tendon constructs at each stage (T0, T3, T7, and T14). Scale bars indicate 500 nm. (E) Quantification of collagen fibril diameter using TEM images from vehicle- and TGFβ1-treated 3D tendon constructs at each stage (n = 3 constructs per group at each stage). (F) hydroxylysylpyridinoline level of vehicle- and TGFβ1-treated 3D tendon constructs at each stage (n = 3 constructs per group at each stage).

