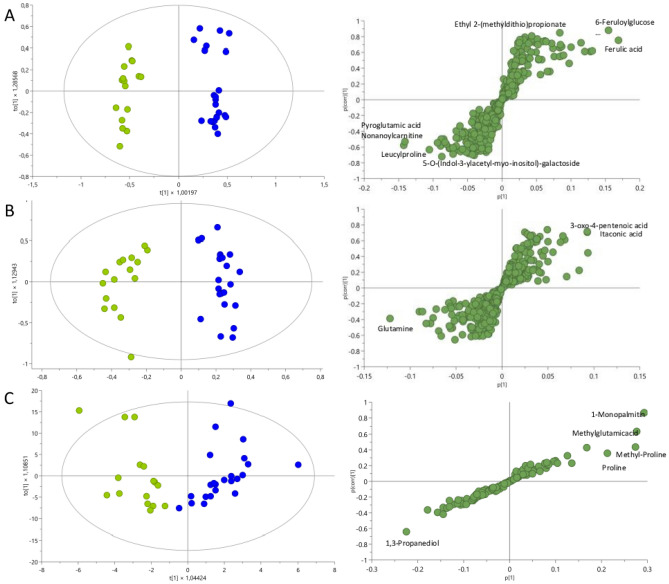
Figure 4.
OPLS-DA models with logarithmic transformation and pareto scaling for the metabolomic profile in urine samples from SLE (green points) and LN (blue points) along with a loadings S-plot illustrating the metabolites significantly contributing to the variation between the compared groups. (A) Untargeted metabolomics through LC–QTOF–MS (+): R2: 0.380 R2Y: 0.969 Q2: 0.853 cv-ANOVA = 5.39e−12. (B) Untargeted metabolomics through LC–QTOF–MS (−): R2: 0.376 R2Y: 0.943 Q2: 0.74. cv-ANOVA = 3.85e−08. (C) Untargeted metabolomics through GC–QTOF–MS: R2: 0.470 R2Y: 0.769 Q2: 0.358 cv-ANOVA = 0.0201.

