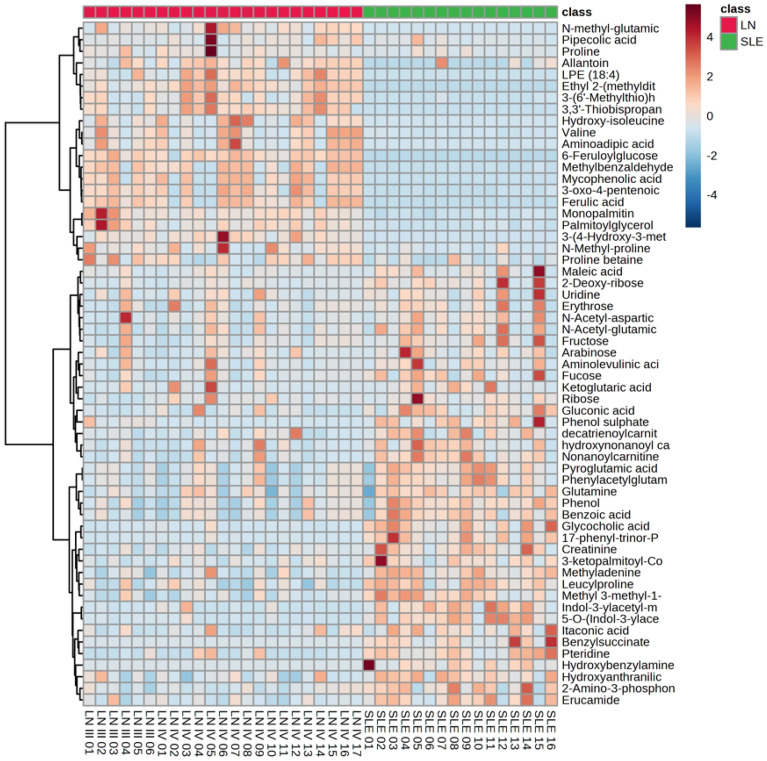
Figure 5.
Heat map for the 59 metabolites identified by LC-QTOF-MS and GC/MS-QTOF using the KEGG database Comparison between the relevant metabolites identified in the LN versus SLE urine samples. On the top right is the colorimetric scale: if the color tends to dark red, then the metabolite's concentration was increased; if the color tends to dark blue, then the metabolite's concentration was decreased. The red and green boxes on the upper right correspond to the LN group (Lupus Nephritis; n = 17; red) and SLE group (systemic lupus erythematous; n = 16; green). On the left side of the heatmap is the clustering division. Results obtained by the cluster analysis performed with MetaboAnalyst 5.0.

