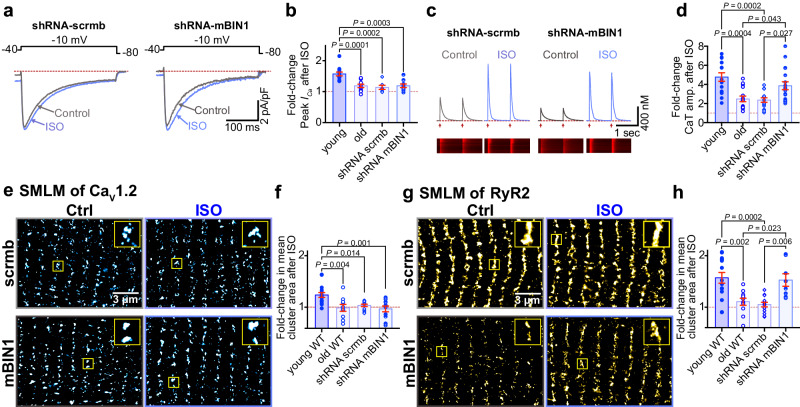
Fig. 6. BIN1 knockdown restores β-AR augmentation of Ca2+ transients and RyR2 clustering dynamics.
a Representative whole-cell currents from shRNA-scrmb and shRNA-mBIN1 myocytes before and during ISO application. b fold change in peak ICa with ISO in young, old, shRNA-scrmb (N = 3, n = 7), and shRNA-mBIN1 (N = 3, n = 9) myocytes. c Representative Ca2+ transients recorded from old shRNA-scrmb and shRNA-mBIN1 myocytes before and after ISO. d Fold increase after ISO from young, old, shRNA-scrmb (N = 3, n = 14), and shRNA-mBIN1 (N = 5, n = 18) myocytes. e SMLM localization maps showing CaV1.2 channel localization on t-tubules of myocytes from old shRNA-scrmb and shRNA-mBIN1, with or without ISO stimulation. Regions of interest are highlighted by yellow boxes. f Fold change in mean CaV1.2 channel cluster area with ISO in the young, old, old shRNA-scrmb (control: N = 3, n = 14; ISO: N = 3, n = 13) and shRNA-mBIN1 myocytes (control: N = 3, n = 12; ISO: N = 3, n = 11). g, h show the same layout for RyR2 immunostained old shRNA-scrmb (control: N = 3, n = 12; ISO: N = 3, n = 13) and shRNA-mBIN1 myocytes (control: N = 3, n = 9; ISO: N = 3, n = 8). Old and young data points in (b, d, f, h) are reproduced from data in Figs. 1b, h, and 2b, d respectively. Statistical analysis was performed on data in (b, d, f, h) using one-way ANOVAs with multiple comparison post-hoc tests. Young data in (b) are pooled from NIA young and JAX young myocytes, data in (d, f, h) are from NIA young myocytes. Note there was no significant difference in ICa, CaV1.2, and RyR2 cluster areas when JAX and NIA young mice were compared (see Supplementary Fig. 1a–g). Data are presented as mean ± SEM. Source data are provided in the Source Data file.

