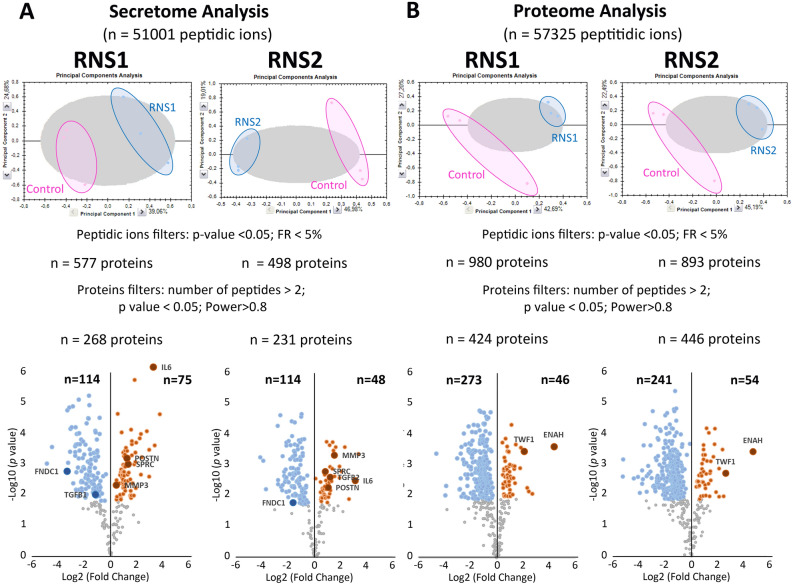
Figure 4.
Mass spectrometry analysis. (A) Differential quantitative analysis between RNS1 (n = 3), RNS2 (n = 3) and Control (n = 3) on secretome. (B) Differential quantitative analysis between RNS1 (n = 3), RNS2 (n = 3) and Control (n = 3) on both cell proteome. By providing different statistical filters (Peptidic ions filters and proteins filters), the number of identified and quantified proteins are mentioned. A volcano plot, highlighting down- (blue circle) and up- (orange circle) regulated proteins, is presented for each comparison.

