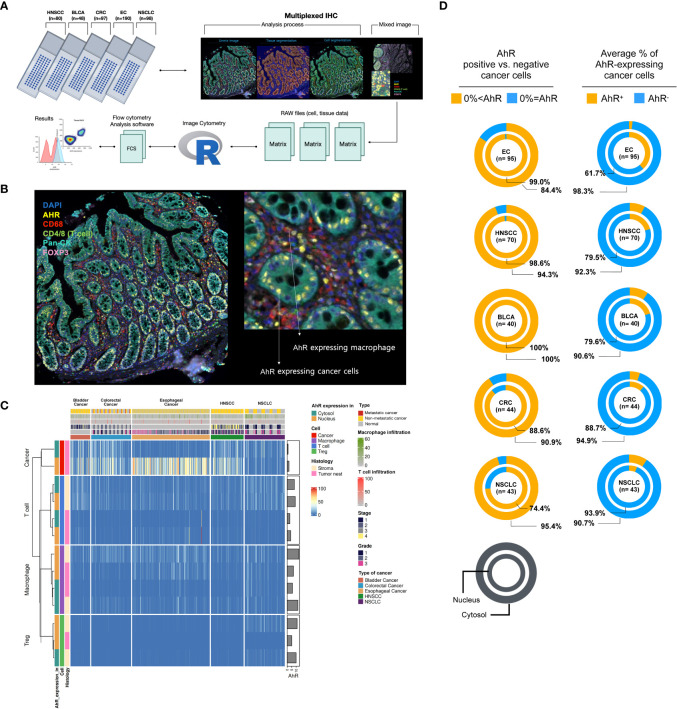
Figure 1.
AhR expression and localization in the TME of bladder, colorectal, esophageal, head and neck, and non-small cell lung cancers. (A) Scheme of the workflow used for generating AhR expression data from five FFPE TMA slides: NSCLC (non-small cell lung cancer, N = 98), HNSCC (head and neck squamous cell carcinoma, N = 80), CRC (colorectal cancer, N = 97), EC (esophageal cancer, N = 190), and BLCA (bladder cancer, N = 48). Prior to cell segmentation and tissue segmentation using the deep-learning inForm algorithm, five TMA slides were stained with six antibodies, DAPI, and anti-AhR, -CD68, -CD4, -CD8, -Pan-CK, and -FoxP3, using Vectra Polaris for mIHC image generation. The resulting data were manipulated to perform image cytometry for phenotyping and AhR expression analysis. (B) Representative mIHC image of the region of interest stained with six antibodies: DAPI for nucleus, Pan-CK for cancer/epithelial cells, CD4 and CD8 for T cells, CD68 for macrophages, and FoxP3 for Tregs. (C) Heatmap summarizing the AhR expression in five different tissue samples: NSCLC, HNSCC, colorectal cancer, esophageal cancer, and bladder cancer. The resulting data were clustered based on the AhR expression in the cytosol or nucleus of cancer/epithelial cells, T cells, macrophages, and Tregs. (D) Pie charts depicting the AhR-positive (AhR+) and -negative (AhR-) cancer cells (left) and average percentage of AhR-expressing cancer cells (right) in the cytosol and nucleus of NSCLC, HNSCC, CRC (colorectal cancer), EC (esophageal cancer), and BLCA (bladder cancer) cells.

