Figure 5.
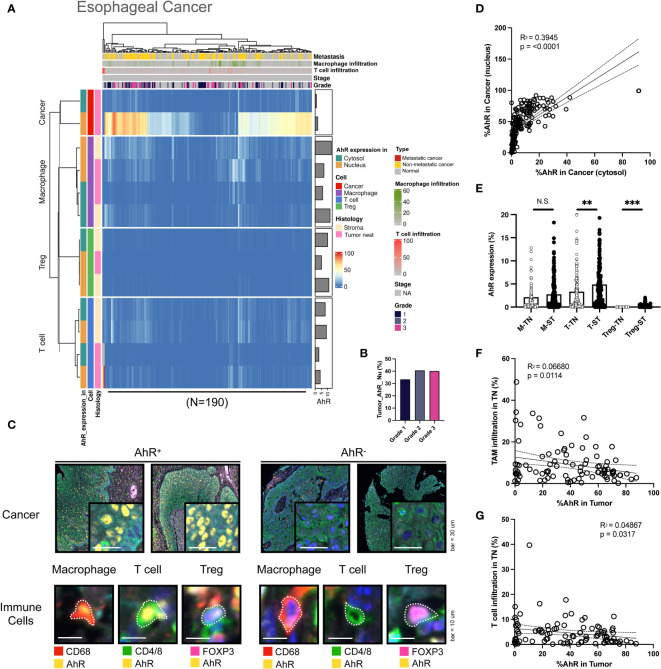
AhR expression patterns in esophageal cancer. (A) Heatmap summarizing the AhR expression and localization in cancer/epithelial cells, T cells, macrophages, and Tregs in normal and malignant esophageal tissues (N = 190). (B) AhR expression in malignant esophageal tissues of varying cancer grades. (C) Representative images of AhR-expressing (AhR+) and non-AhR-expressing (AhR-) esophageal cancer cells, along with AhR-expressing immune cells, including macrophages, T cells, and Tregs. (D) AhR expression in the cytosol is positively correlated with the nuclear AhR expression (P < 0.0001). (E) AhR expression in T cells (T), macrophages (M), and Tregs in the stroma (ST) and tumor nest (TN). (F) Correlation plot showing no significant correlation between AhR expression in cancer cell nucleus and the TAM infiltration degree in the TN. (G) Correlation plot showing no significant correlation between AhR expression in cancer cell nucleus and the T-cell infiltration degree in the TN. N.S., no significant difference, **P < 0.01, ***P < 0.001.

