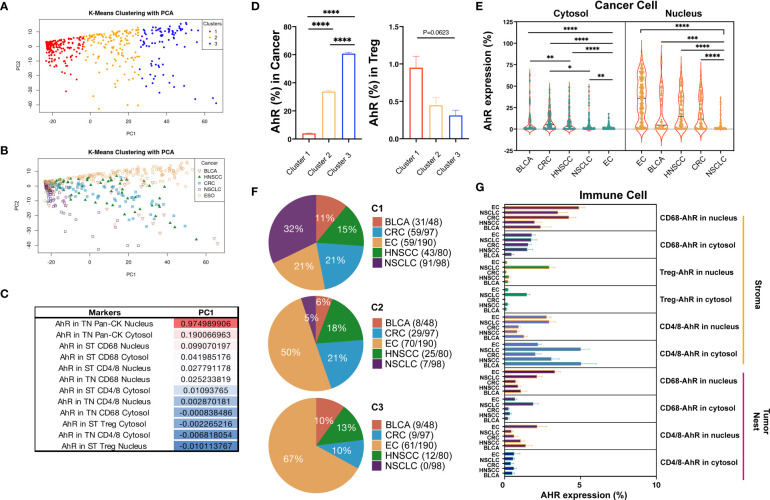
Figure 7.
Differential AhR expression based on different cell types and locations. (A) PCA plot distinguishing the three clusters from each group. (B) PCA plot distinguishing the five cancer types from each group. (C) PC1 table displaying the AhR expression in different locations, including the cytosol vs. nucleus, tumor nest (TN) vs. stroma (ST), and different markers (Pan-CK, CD68, CD4/8, and Treg). (D) Bar graph showing the AhR expression in cancer cell nucleus and stromal Treg nucleus in three different clusters. (E) Pie chart representing the distribution of the five cancer types within the three different clusters. (F) Violin plot portraying the AhR expression in the cytosol vs. nucleus in the five cancer types. (G) Bar graph depicting the AhR expression in the tumor and immune cell types in the five cancer types. *P < 0.05, **P < 0.01, ***P < 0.001, ****P < 0.0001.

