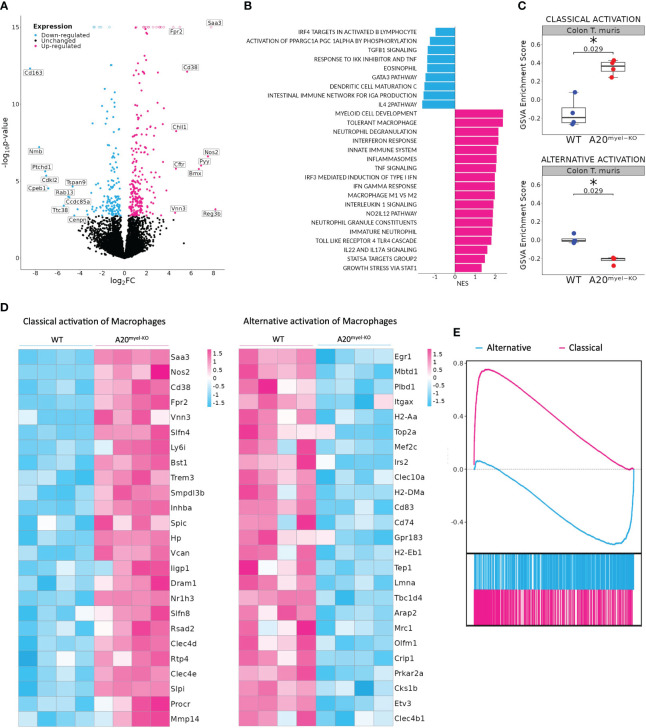
Figure 4.
A20myel-KO are characterized by M1 macrophage signature upon Trichuris muris infection. (A) Bulk RNA sequencing volcano plots presenting the differentially expressed genes in CD11b+ sorted cells of WT (blue) and A20myel-KO (magenta) colon samples of mice infected with T. muris for 10 days. (B) Gene ontology pathway analysis showing the positively regulated pathways in WT (blue) and A20meyl-KO (magenta) colon CD11b+ cells of mice infected with T. muris for 10 days. (C) Gene scoring analysis using M1 and M2 signatures, consisting of 710 and 806 genes, respectively, to compare the expression in WT and A20myel-KO colon upon T. muris infection. (D) Heatmap showing the upregulation of the top 25 markers related to classical activation of macrophages (M1) in A20myel-KO mice compared with WT (left). Heatmap showing the upregulation of the top 25 markers related to the alternative activation of macrophages (M2) in WT compared with A20myel-KO mice (right). (E) Gene set enrichment analysis (GSEA) plots visualizing the enrichment of classical (M1, upper panel) and alternative (M2, lower panel) activation of macrophages in A20myel-KO and WT, respectively. Each plot features the running enrichment score (y-axis) and shows the placement of the ranked differentially expressed genes for the respective transcriptomic signature (x-axis).

