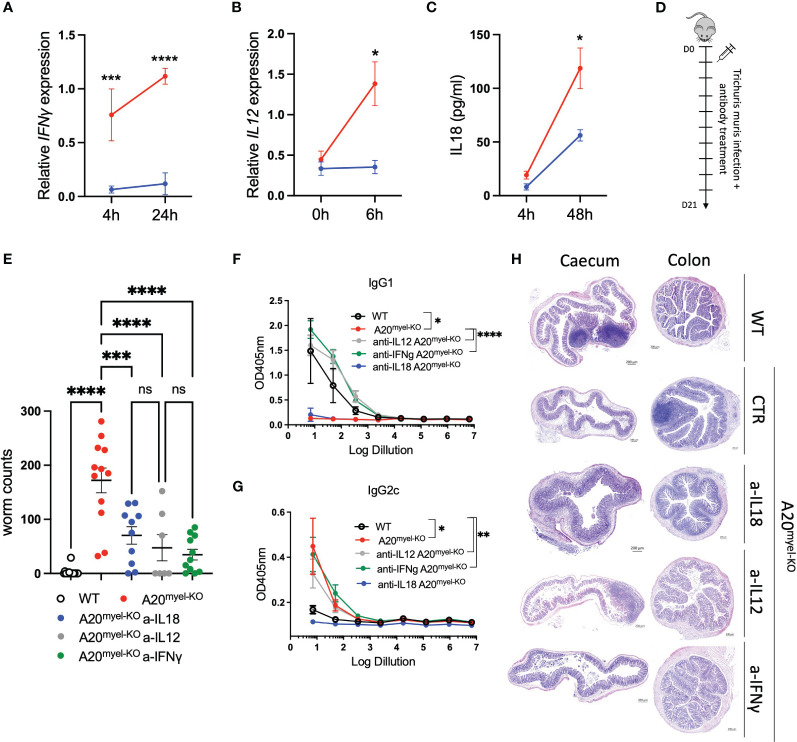
Figure 5.
Blocking Th1-related cytokine reverse susceptibility of A20myel-KO to Trichuris muris. (A) Relative IFN-γ expression in BMDMs derived from WT (blue) and A20myel-KO (red) stimulated with Trichuris antigen for 4 h and 24 h. (B) Relative expression of IL-12 in WT (blue) and A20myel-KO (red)-derived BMDMs stimulated for 0 h and 6 h with T. muris antigen. (C) IL-18 levels in the supernatant of WT (blue) and A20myel-KO (red)-derived BMDMs, stimulated with Trichuris antigen for 4 h and 48 h. (D) Infection and treatment scheme with T. muris and neutralizing antibodies against IFN-γ, IL-12, and IL-18. (E) Worm counts in the cecum of WT (n = 15, open dots), A20myel-KO+IgG control antibody (n = 12, red), A20myel-KO+a-IL-18 (n = 10, blue), A20myel-KO+a-IL-12 (n = 7, gray), and A20myel-KO+a-IFN-γ (n = 11, green) 21 days after infection with T. muris. The graph represents the combined data of three independent experiments. (F) ELISA for IgG1 and (G) IgG2c levels in the blood serum of WT and A20myel-KO mice treated as in (B). Significance refers to log dilution 1. (H) Representative images of AB/PAS staining of cecum and colon sections of WT and A20myel-KO mice infected with T. muris and treated with neutralizing antibodies, as in (B). Scale bars 200 μm. Data are presented as means ± s.e.m. Statistical significance was determined by a two-sided Student’s t-test or by one-way ANOVA for multiple comparisons. * p<0,05, ** p<0,01, *** p<0,001, **** p < 0.0001. Ns, Not significant.

