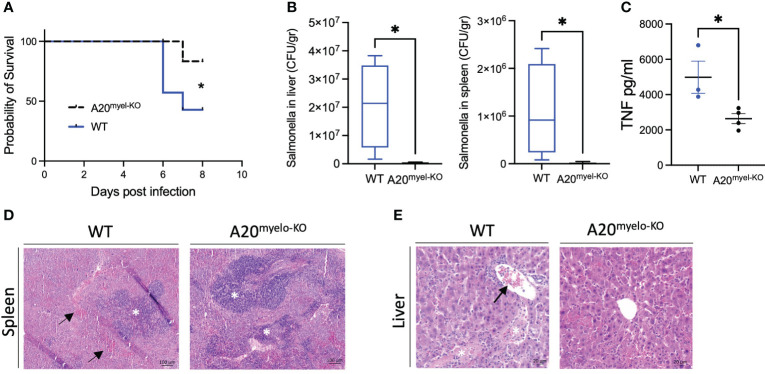
Figure 6.
A20myel-KO mice are protected against Salmonella typhimurium infection. (A) Survival curve of WT (n = 7) and A20myel-KO (n = 6) mice during 8 days of infection with S. typhimurium. Statistical analysis is performed using the Gehan–Breslow–Wilcoxon test. (B) CFU counts of retrieved S. typhimurium from the liver and spleen of infected WT (n = 4) and A20myel-KO (n = 5) 8 days post-infection. (C) ELISA for TNF levels in the blood serum of WT (n = 4) and A20myel-KO (n = 5) 8 days post-infection. Data are presented as means ± s.e.m. Statistical significance was determined by a two-sided Student’s t-test. (D) Representative images of H&E staining of spleens of infected WT and A20myel-KO mice. The black arrows indicate hematopoiesis (red pulp) and the white asterisks indicate the lymphoid tissue (white pulp). Scale bar 100 μm. (E) Representative images of H&E staining of the liver of infected WT and A20myel-KO mice. The black arrow indicates immune cell infiltration and the white asterisks indicate the necrotic areas. Scale bar 20 μm. * p<0,05.

