
Figure 3: Copper increases ThS+ Htt aggregates.
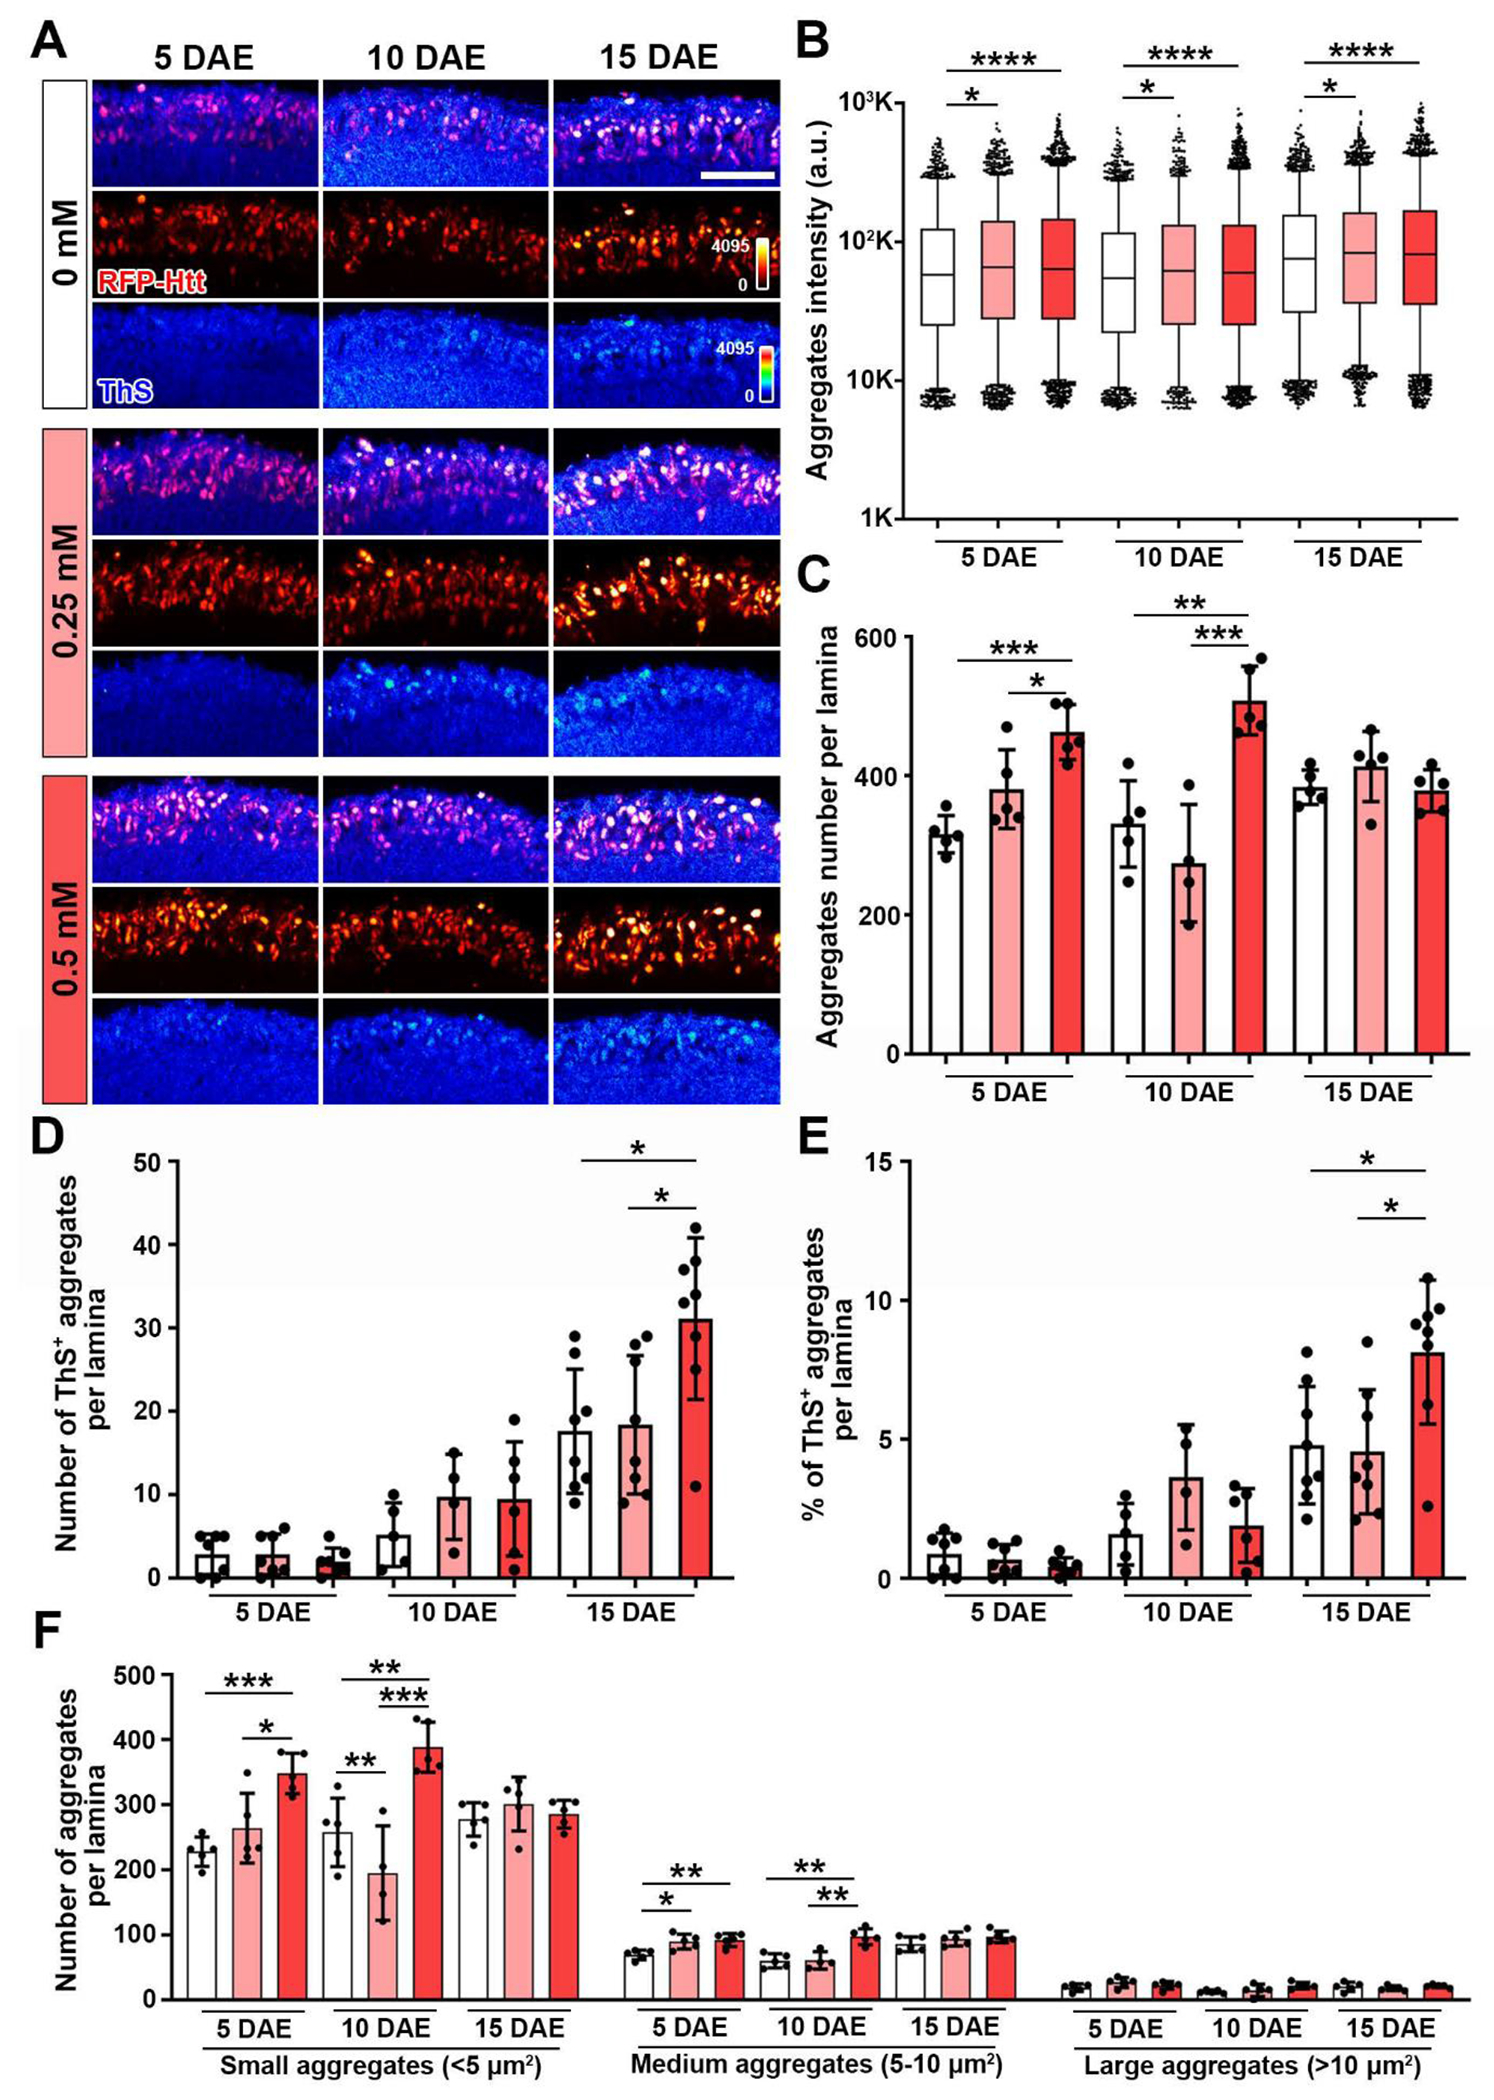
(A) ThS staining of the lamina layer (ThS and RFP-Htt heatmaps 0-4095) at 5 DAE, 10 DAE, and 20 DAE. Scale bar: 30μm (B) Quantification of Htt aggregates intensity. Data are presented as box and whiskers plot, 5-95 percentile. (C) Quantification of Htt aggregates number per lamina. Data are presented as mean ± SD. (D) Number of ThS+ aggregates per lamina. Data are presented as mean ± SD. (E) Percentage of ThS+ aggregates per lamina. Data are presented as mean ± SD. (F) Quantification of number of aggregates per lamina separated by size: Small (<5 μm2), Medium (5-10 μm2) and Large (>10 μm2). Data are presented as mean ± SD. n=3-8, *p<0.05, **p<0.01, ***p<0.001, ****p<0.0001.