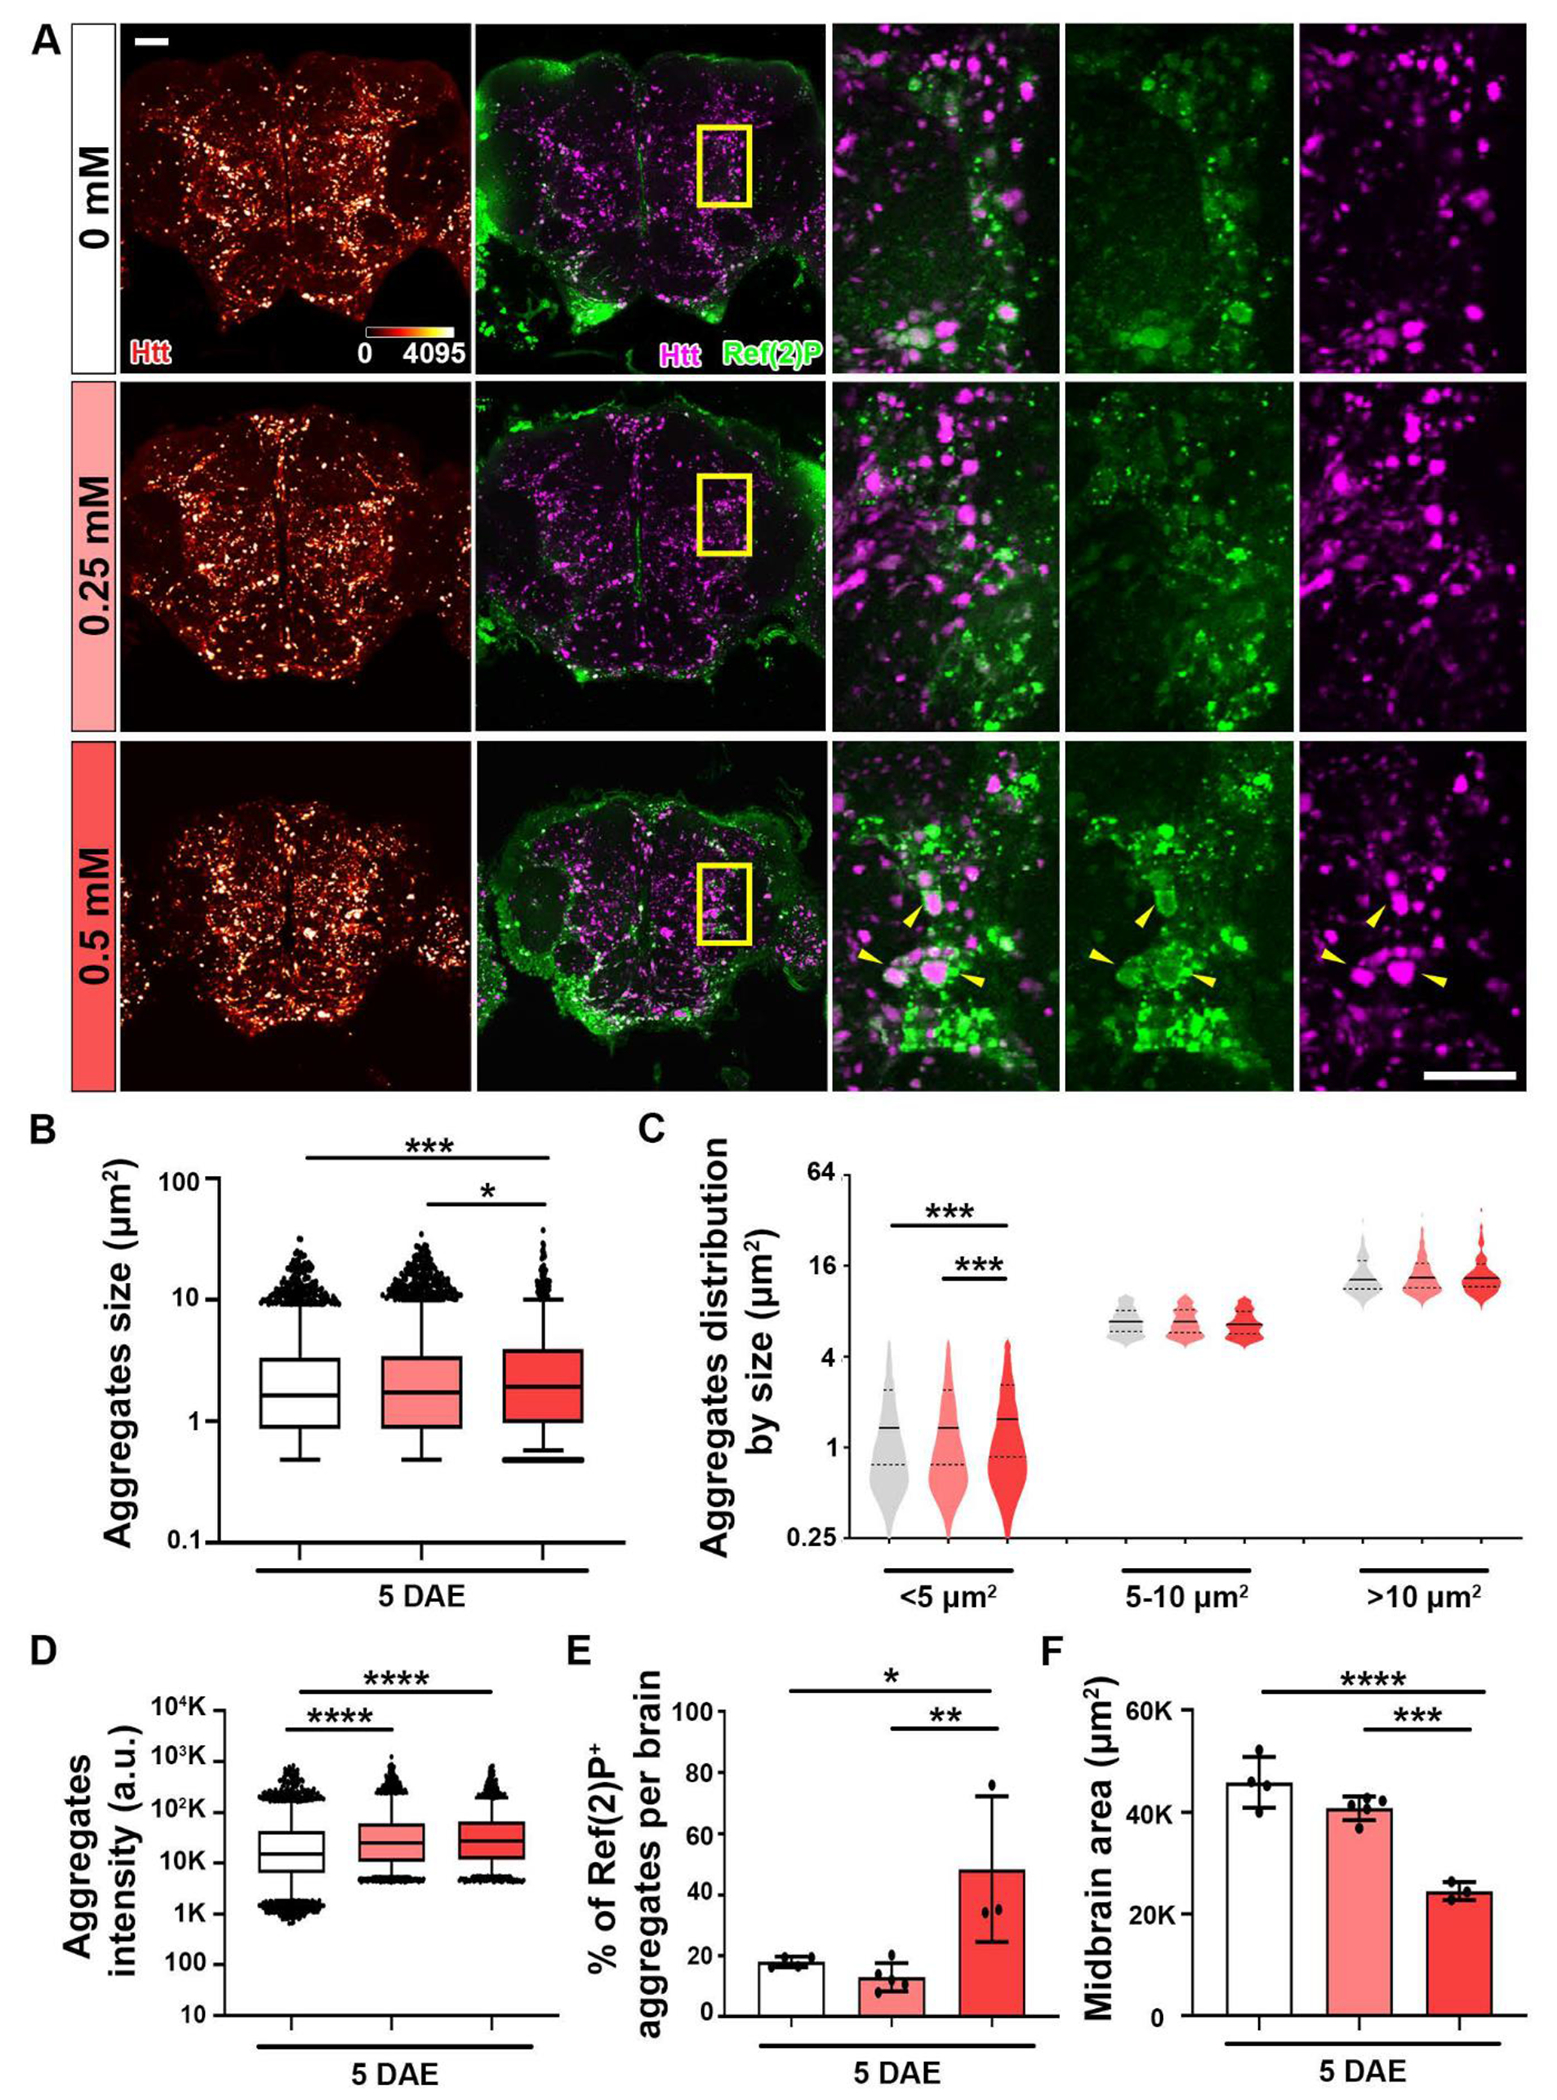
Figure 4: Copper increases Ref(2)P+ Htt aggregates.

Pathological Htt-Q138 flies driven by elav-GAL4 were fed with different CuCl2 concentrations until 5 DAE. (A) Midbrain shown with accumulation of Htt aggregates (heatmap 0-4095). Merged image of Htt aggregates (magenta) and Ref(2)P (green) staining. Yellow boxed areas are shown in higher magnification. Yellow arrows pointing at co-localization. Scale bar = 30 μm. (B) Quantification of total aggregate size. Data are presented as box and whiskers plot, 5-95 percentile. (C) Quantification of size distribution. Small aggregates are classified as <5 μm2, medium aggregates as 5-10 μm2, and large aggregates as >10 μm2. Data are presented as violin plot with quartiles. (D) Quantification of total aggregate intensity. Data are presented as box and whiskers plot, 5-95 percentile. (E) Quantification of percentage of Ref(2)P+ aggregates per lamina. Data are presented as mean ± SD. (F) Quantification of midbrain. Data are presented as mean ± SD. n=3-5, *p<0.05, **p<0.01, ***p<0.001, ****p<0.0001.
