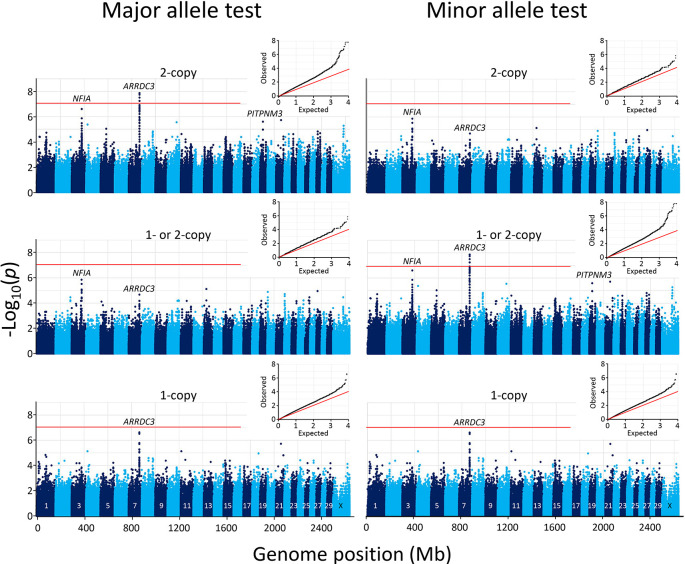
Figure 3. Manhattan and Q-Q plots of genome-wide association with 102 BCHF matched case-control pairs.
The mid- p-values from the McNemar’s association test were used with major (left) and minor alleles (right). In both panels, the inset shows the Q-Q plot of the distribution of the test statistics and the red horizontal line shows the Bonferroni correction at an α of 0.05.

