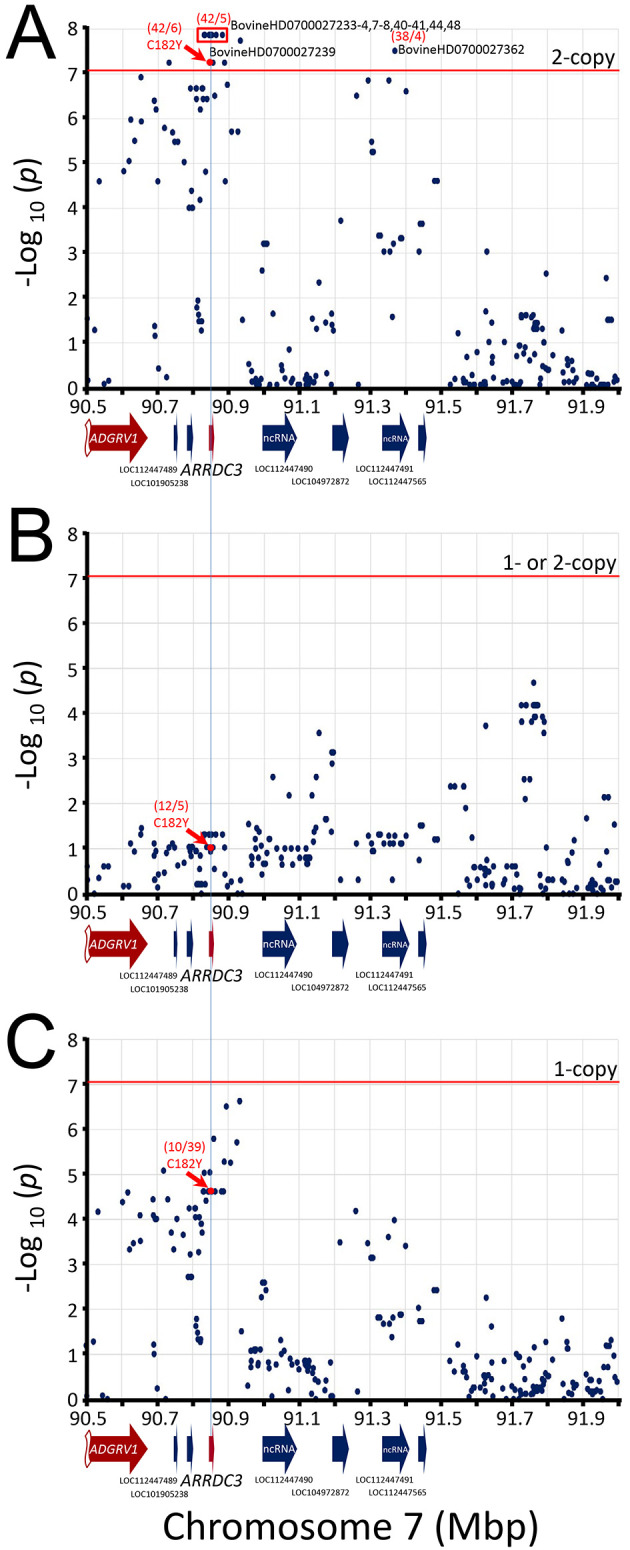
Figure 5. Manhattan plot of ARRDC3 gene region.

The mid- p-values from the McNemar’s association test of the most frequent SNP alleles were used. Panel A, test requiring the presence of homozygous risk alleles. Panel B, test requiring the presence of either 1- or 2-copies of the risk alleles. Panel C, test requiring heterozygosity for the risk alleles. The red horizontal line shows the Bonferroni correction at the 0.05 significance level. The red numbers in parentheses are McNemar's informative pairs from quadrants b and c (i.e., “ b/ c“, Table 1). The ratio of informative pairs indicates the strength of the association, and whether the allele is positively or negatively associated with BCHF (i.e., b/c > 0 or < 0).
