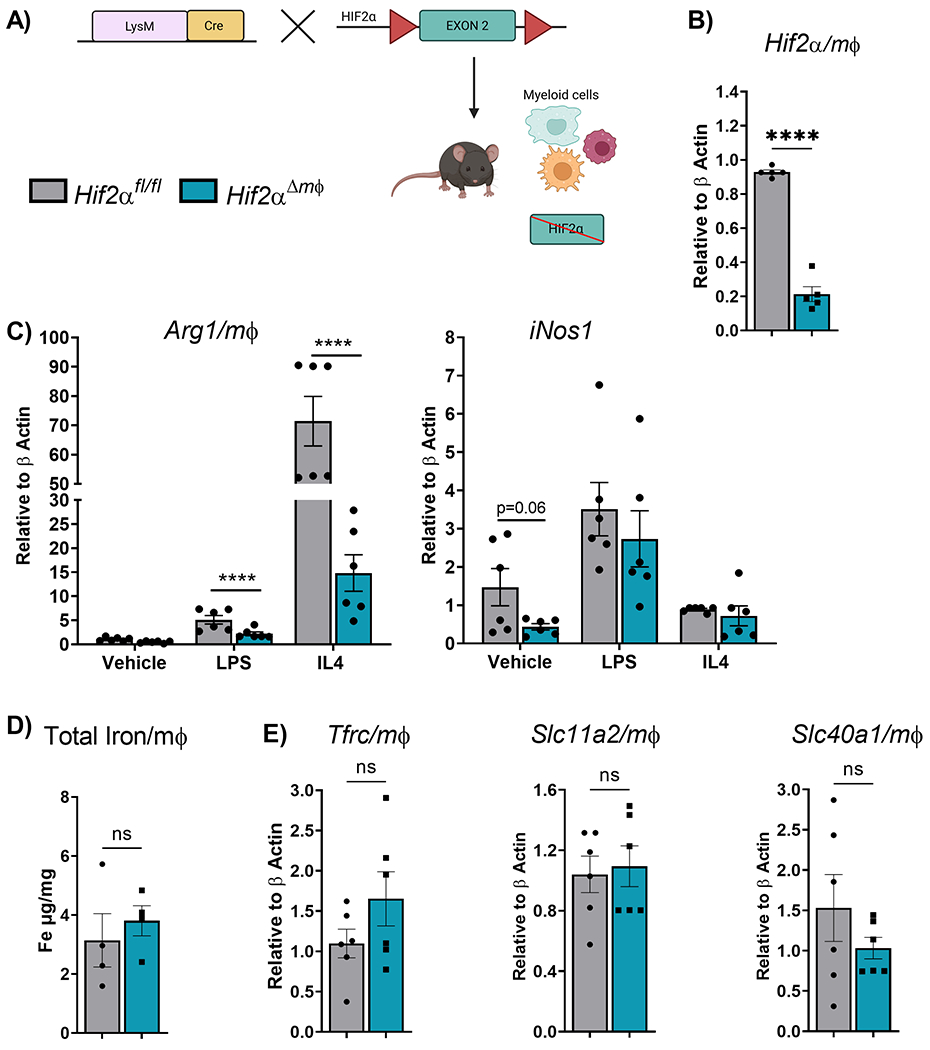
Figure 1. Hif2α deletion in macrophages does not alter expression of iron transporter.

(A) Schematic representation of mice with disruption of Hif2α in the myeloid lineage cells. (B) qPCR analysis of macrophage Hif2α transcript expression levels (n=5-7 per group). (C) qPCR analysis of Arg 1 and iNos1 from Bone marrow derived macrophages (BMDMs) maintained in GMCSF (10ng/mL) for 5 days followed by treatment with IL4 (20ng/mL) and LPS (20ng/mL) for 48 hours (n=4-5 per group). (D) Total intracellular iron measured by Inductively coupled plasma mass spectrometry (ICP-MS). (E) qPCR analysis of macrophage Tfrc (Transferrin receptor), Slc11a2 (Dmt1), Slc40a (Fpn) transcript expression levels (n=5–7 per group). Data represent the mean ± SEM. Significance was determined by unpaired t test. *P < 0.05, ***P < 0.001, and ****P < 0.0001 versus the Hif2αfl/fl group.
