
Figure 9.
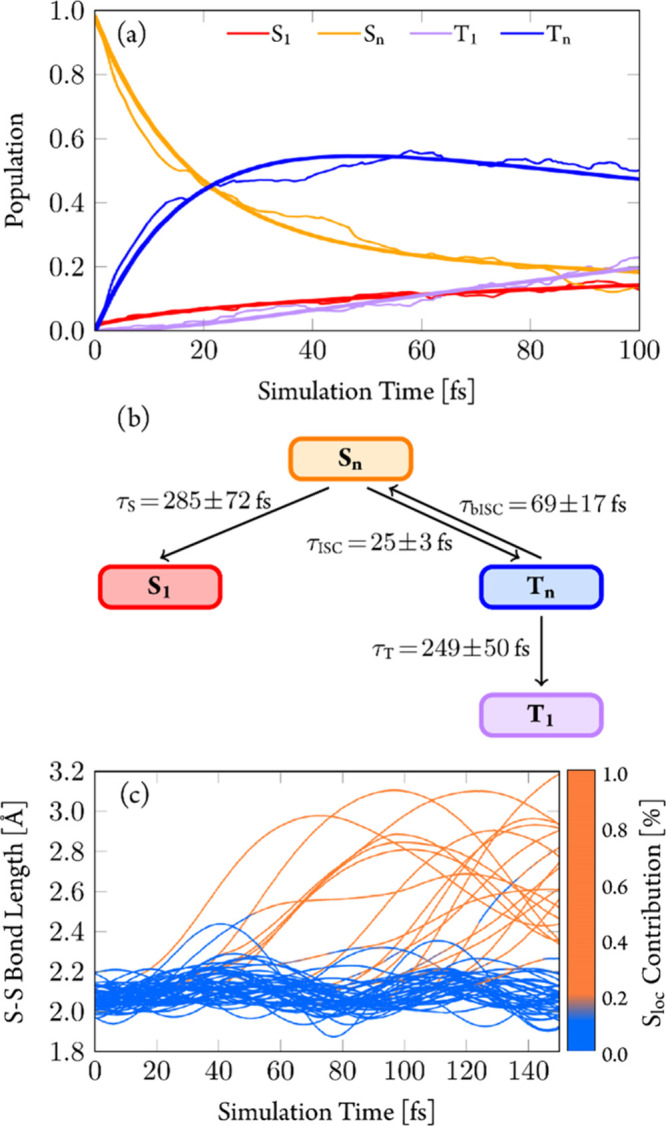
(a) Adiabatic electronic-state populations from TDDFT/SH dynamics. Higher-lying singlet and triplet states combined to one line each. Thick lines represent fitted curves according to the mechanism shown in (b). (c) Time evolution of S–S bond length for individual trajectories. Color coding for the amount of Sloc excitation character from the transition-density matrix analysis.