
Fig 4.
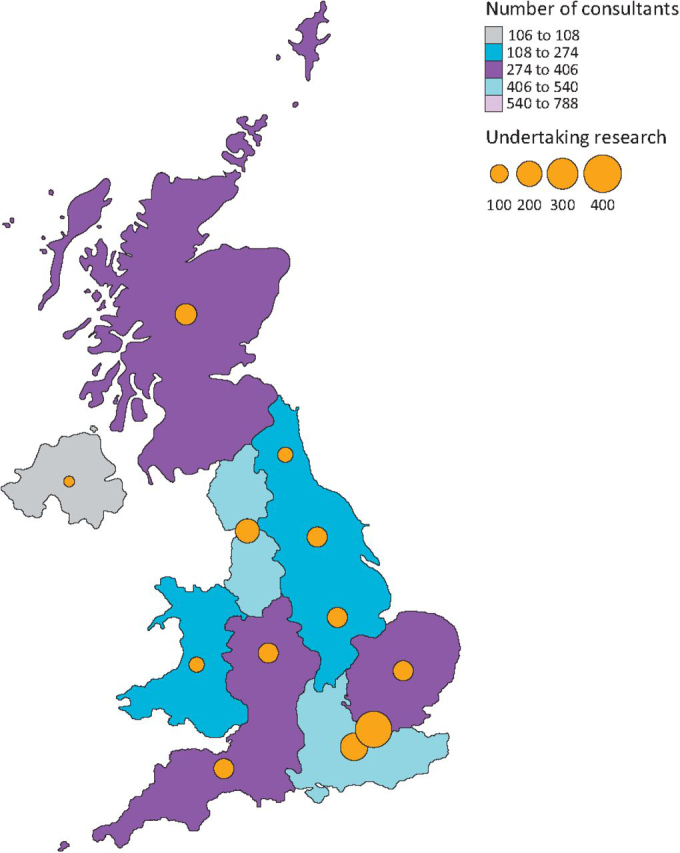
A geographical plot demonstrating the distribution of consultant physicians across the UK. The bubbles represent the number of consultant physicians undertake research.
Official websites use .gov
A
.gov website belongs to an official
government organization in the United States.
Secure .gov websites use HTTPS
A lock (
) or https:// means you've safely
connected to the .gov website. Share sensitive
information only on official, secure websites.
A geographical plot demonstrating the distribution of consultant physicians across the UK. The bubbles represent the number of consultant physicians undertake research.