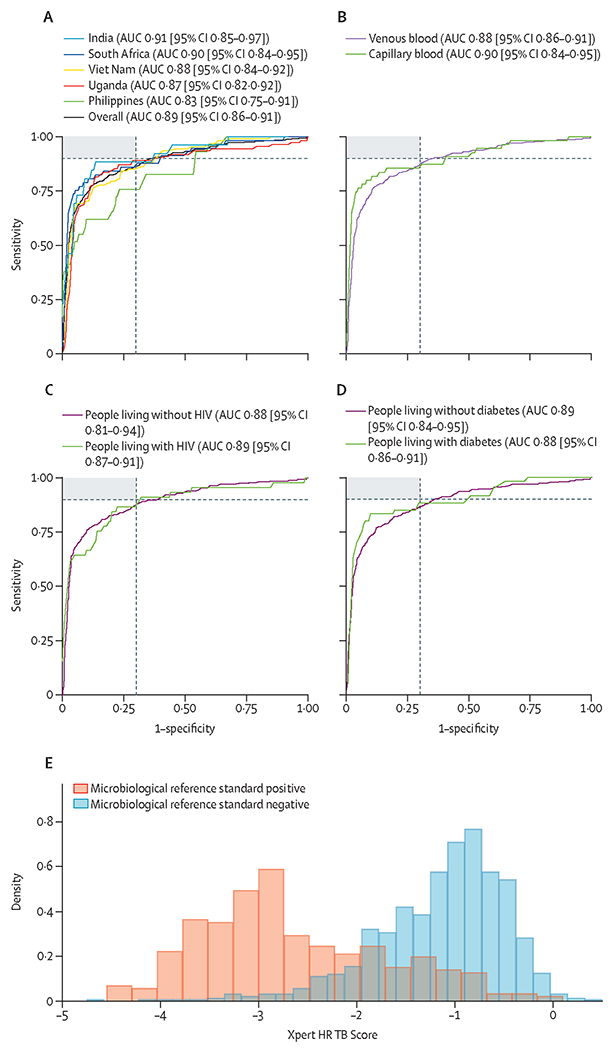
Figure 2: Xpert HR TB Score ROC curve analysis against microbiological reference standard.
(A) The overall ROC curve for TB Score and by country. (B) ROC curves by blood collection method. (C) ROC curves by HIV status. (D) ROC curves by diabetes status. The shaded region in charts A–D shows cutoff values that meet both the WHO target product profile minimal target sensitivity (≥90%) or specificity (≥70%), the dashed grey lines show the WHO target product profile minimal targets. AUCs and 95% CIs overall, and by country and subgroup, are in appendix 3 (p 14). (E) Xpert HR TB Score by microbiological reference standard. Median TB Score was −2·85 (IQR −3·28 to −2·18) for participants positive by microbiological reference standard, and −1·05 (IQR −1·50 to −0·70) for participants negative by microbiological reference standard. AUC=area under the ROC. ROC=receiver operating characteristic. Xpert HR=Xpert MTB Host Response.

