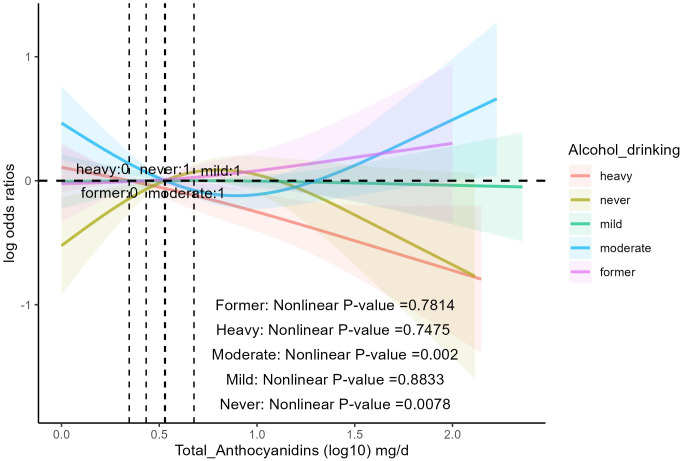
Figure 3.
The association of flavonoid intake with the prevalence of hypertension on alcohol drinking by restricted cubic splines. The y-axis stands for the Log odds ratio of hypertension, and the X-axis stands for the log10 transformed intake of total anthocyanidins. Models by restricted cubic splines were adjusted for age, race, sex, BMI, daily energy intake, smoking status, education, total MET of PA, PIR, hyperlipidemia, heart attack, stroke, congestive heart failure, coronary heart disease, and diabetes.

