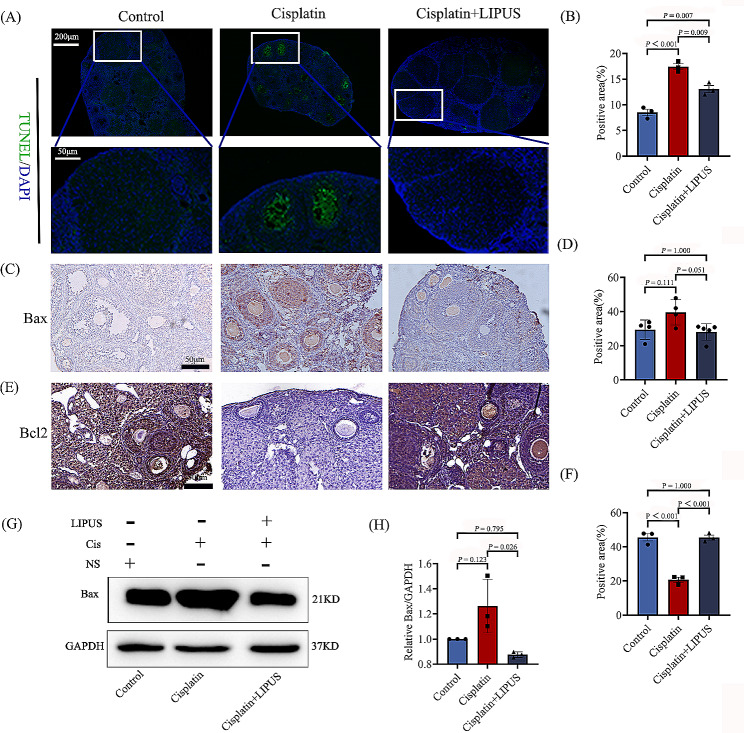
Fig. 3.
The apoptosis of ovarian tissue in three groups. (A): TUNEL fluorescence staining of the three groups. Green indicates positive staining areas (100 μm and 50 μm). (B): Statistical histogram of TUNEL staining. (C): The expression of Bax in ovarian tissues of the three groups was detected via IHC. Brown indicates positive staining areas (50 μm). (D): Statistical histogram of Bax by IHC. (E): The expression of Bcl-2 in ovarian tissues of the three groups was detected via IHC. Brown indicates positive staining areas (50 μm). (F): Statistical histogram of Bcl-2 by IHC. (G-H): The expression of Bax in ovarian tissues of the three groups was detected by using Western blotting, and a statistical histogram was conducted (All results were corrected by Bonferroni method, and P < 0.05 after correction was considered to be statistically significant); n ≥ 3

