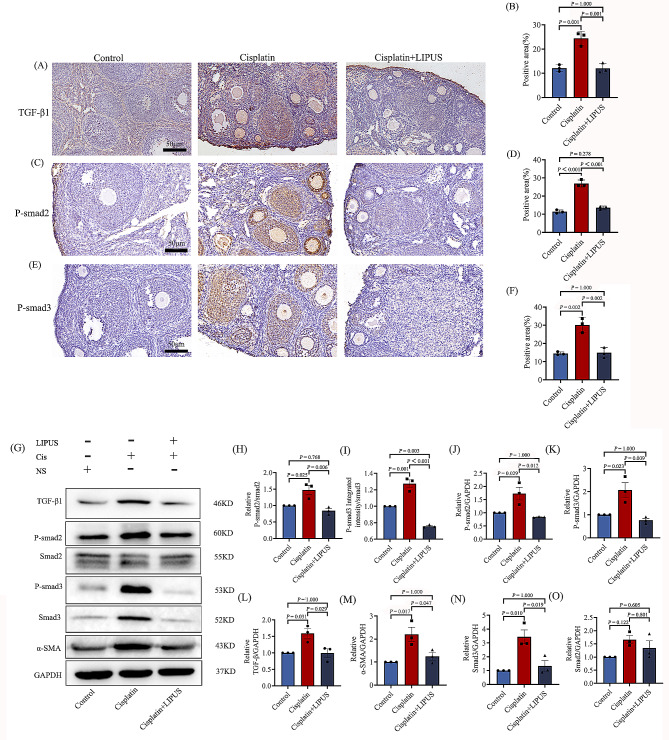
Fig. 6.
IHC and WB were used to verify the mechanisms associated with fibrosis. (A-B): IHC detection of TGF-β1in three groups (50 μm) and statistical bar chart. The brown area indicate positivity area. (C-D): IHC detection of p-smad2 in three groups (50 μm) and statistical bar chart. The brown area indicate positivity area. (E-F): IHC detection p-smad3 in three groups (50 μm) and statistical bar chart. The brown area indicate positivity area. (G): The expressions of TGF-β1, p-smad2, p-smad3, smad2, smad3, a-SMA and GAPHD in the ovaries of each group are analyzed by Western blot. (H-O): Quantitative analysis of protein expression of p-smad2/smad2, p-smad3/smad3,p-smad2, p-smad3, TGF-β1, a-SMA, smad2, and smad3. (All results were corrected by Bonferroni method, and P < 0.05 after correction was considered to be statistically significant); n ≥ 3. LIPUS = low-intensity pulsed ultrasound

