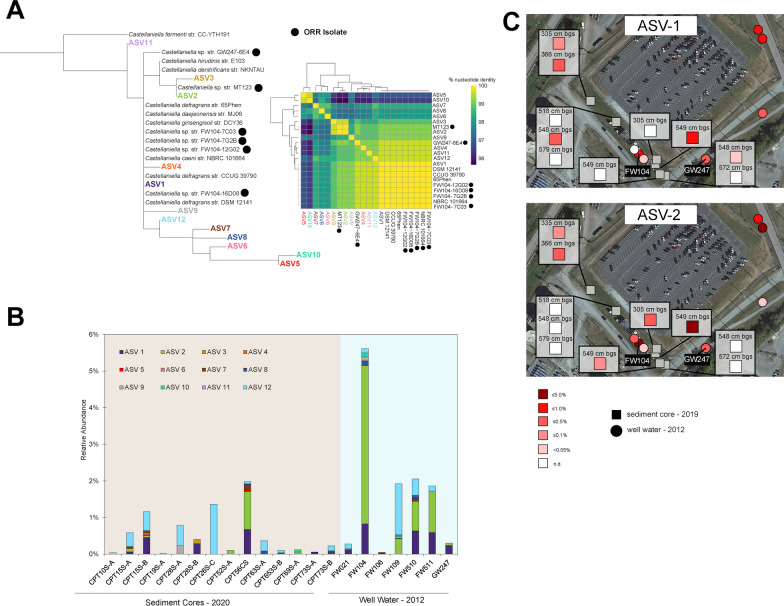
Fig. 1.
Ecology of ORR Castellaniella populations. A Maximum-likelihood tree of Castellaniella 16S rRNA gene V4 regions, incorporating the ORR ASVs (left) and a matrix showing the percentage nucleotide identity for the same set of sequences (right). ORR isolates are indicated with a black circle. The associated alignment is shown in Additional file 1: Fig. S2. B Relative abundances of Castellaniella ASVs around the former S-3 ponds. Only samples with detectable Castellaniella ASVs are shown. C Spatial distributions in the ORR subsurface of two dominant ASVs with cultured representatives. Map data provided by Google Maps ©2023 Airbus, Maxar Technologies, U.S. Geological Surveym USDA/FPAC/GEO

