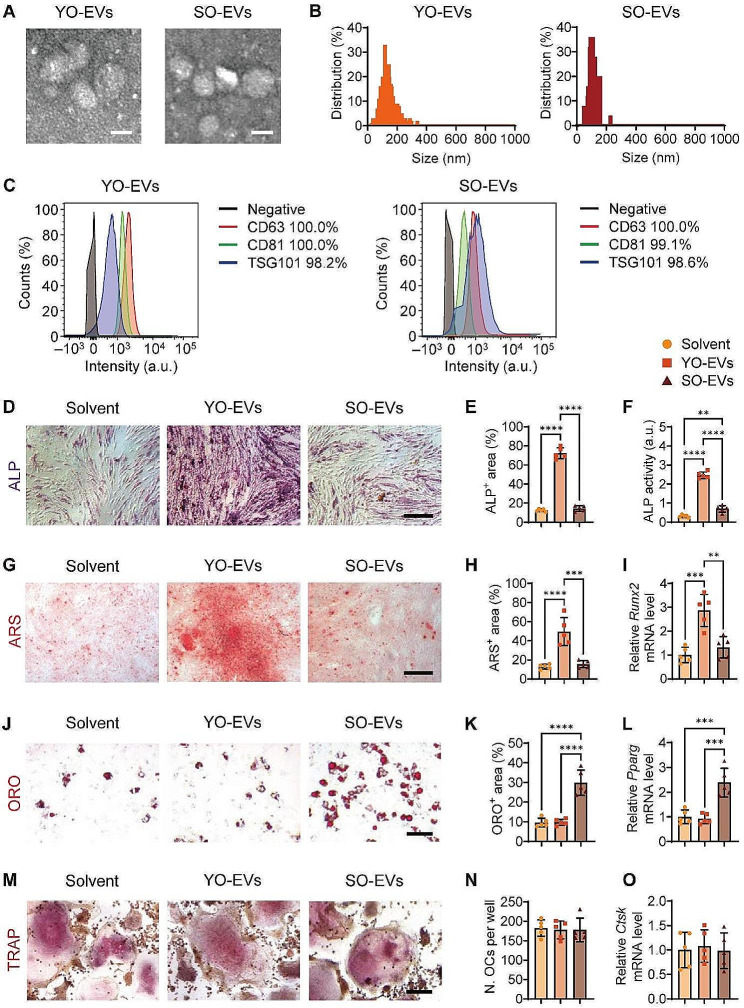
Fig. 1.
Stimulation of BMSC osteogenesis by YO-EVs and induction of BMSC adipogenesis by SO-EVs. Representative morphological analysis by TEM (A), diameter distribution by NTA (B), and classical EV markers (CD63, CD81, and TSG101) by flow cytometry (C) of YO-EVs and SO-EVs. Scale bar: 100 nm. Secondary antibody incubation alone served as the negative control (black curves). ALP staining (D; violet), ARS staining (G; red), quantification of the percentages of ALP+ area (E) and ARS+ area (H), cellular ALP activity (F), and qRT−PCR analysis of Runx2 (I) of BMSCs treated with Solvent, YO-EVs, or SO-EVs under osteogenic induction. ORO staining (J; red), quantification of the percentages of ORO+ area (K), and qRT−PCR analysis of Pparg (L) of BMSCs treated with Solvent, YO-EVs, or SO-EVs under adipogenic induction. TRAP staining (M; violet), quantification of the number of osteoclasts (OCs) per well (N), and qRT−PCR analysis of Ctsk (O) of BMMs treated with Solvent, YO-EVs, or SO-EVs under osteoclastogenic induction. Scale bar: 50 μm. n = 5 per group. PBS treatment was used in the solvent groups. ** P < 0.01, *** P < 0.001, **** P < 0.0001

