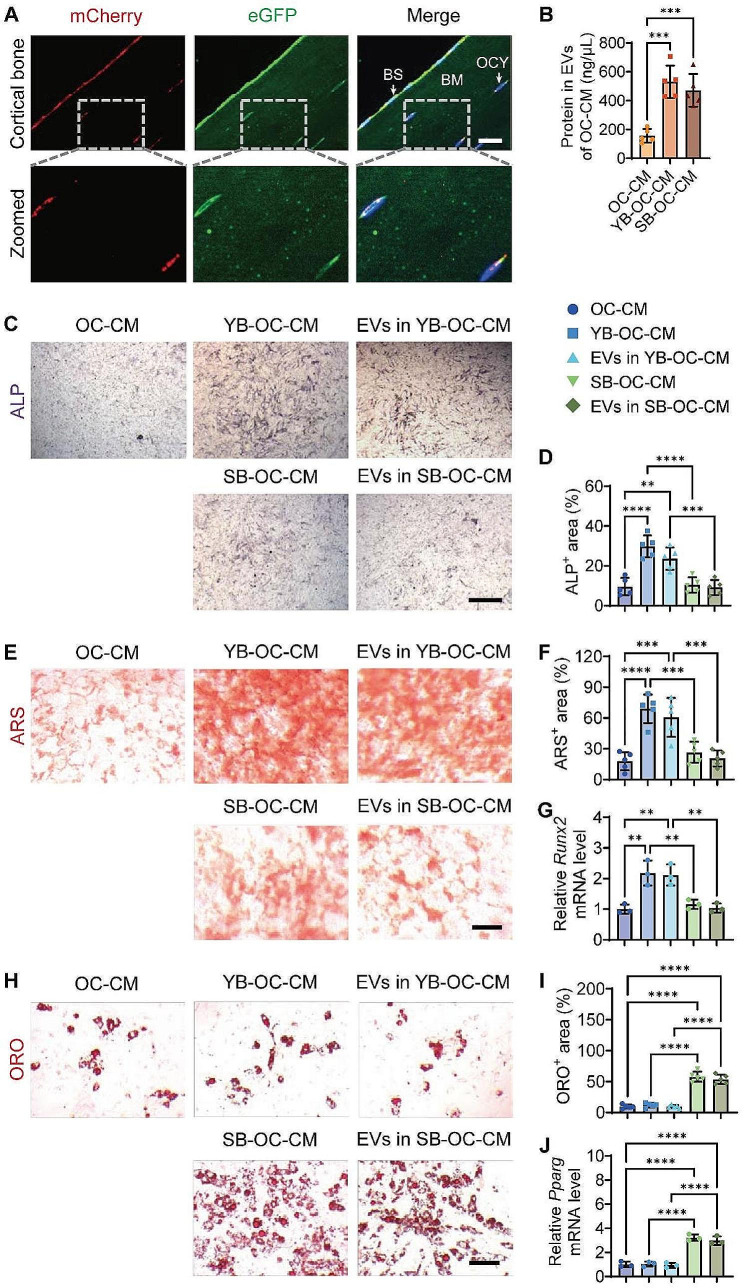
Fig. 2.
Effects of age-related EVs released from bone matrix on BMSC differentiation. Representative IF staining of mCherry (red) and eGFP (green) in bone matrix sections from Dmp1Cre;Cd63loxp−mCherry−loxp−eGFP mice (A). Cell nucleus was stained with DAPI (blue). The merged images were overlaid on the right side, and the dashed square line indicated the zoomed regions. BS: bone surface, BM: bone matrix, OCY: osteocytes. Scale bar: 20 μm. Total protein contents of EVs isolated from the conditioned medium of mature osteoclasts treated with solvent (OC-CM), young bone (YB-OC-CM), or senescent bone (SB-OC-CM) (B). OC: osteoclasts; CM: conditioned medium. n = 5 per group. ALP staining (C; violet), ARS staining (E; red), ORO staining (H; red), quantification of the percentages of ALP+ area (D), ARS+ area (F), ORO+ area (I), qRT−PCR analysis of Runx2 (G) and Pparg (J) of BMSCs with the indicated treatment under osteogenic or adipogenic induction. Scale bar: 50 μm. n = 5 or 3 (qRT−PCR analysis) per group. ** P < 0.01, *** P < 0.001, **** P < 0.0001

