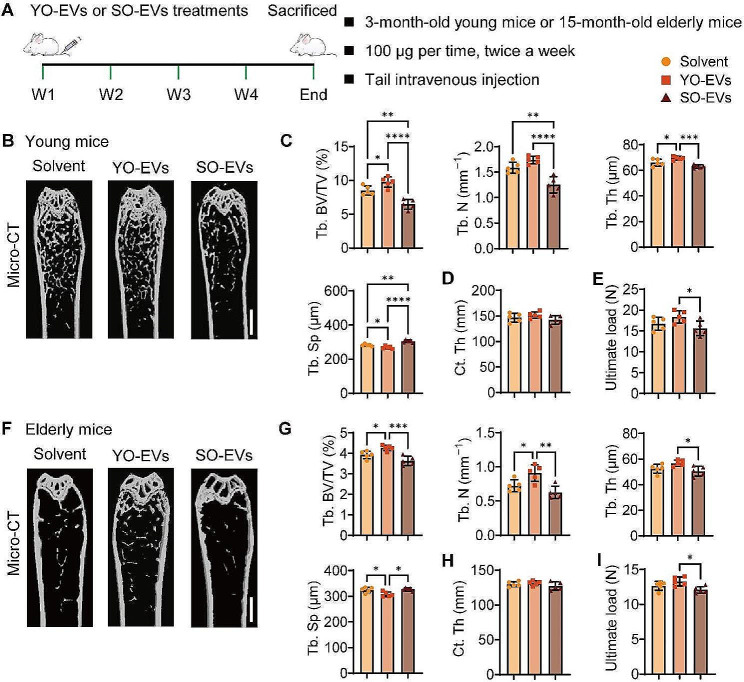
Fig. 3.
Effects of YO-EVs and SO-EVs on bone mass in young and elderly mice. Schematic diagram of the experimental design for assessing the effects of YO-EVs and SO-EVs on bone mass in young and elderly mice (A). µCT-reconstructed images of femurs from young mice (B) or elderly mice (F) treated with Solvent, YO-EVs, or SO-EVs. Scale bars: 1 mm. Quantification of Tb. BV/TV, Tb. N, Tb. Th, Tb. Sp of trabecular bone (C for young mice; G for elderly mice), and Ct. Th of cortical bone (D for young mice; H for elderly mice). Three-point bending measurement of the femoral ultimate load values from young mice (E) or elderly mice (I) with the indicated treatment. n = 5 per group. PBS treatment was used in the solvent groups. * P < 0.05, ** P < 0.01, *** P < 0.001, **** P < 0.0001

